Bank of Montreal 2004 Annual Report Download - page 20
Download and view the complete annual report
Please find page 20 of the 2004 Bank of Montreal annual report below. You can navigate through the pages in the report by either clicking on the pages listed below, or by using the keyword search tool below to find specific information within the annual report.-
 1
1 -
2
-
3
-
4
-
5
-
6
-
7
-
8
-
9
-
 10
10 -
 11
11 -
 12
12 -
 13
13 -
 14
14 -
 15
15 -
 16
16 -
 17
17 -
 18
18 -
 19
19 -
 20
20 -
 21
21 -
 22
22 -
 23
23 -
 24
24 -
 25
25 -
 26
26 -
 27
27 -
 28
28 -
 29
29 -
 30
30 -
31
-
32
-
33
-
34
-
35
-
36
-
37
-
38
-
39
-
40
-
41
-
42
-
43
-
44
-
45
-
46
-
47
-
48
-
49
-
50
-
51
-
52
-
53
-
54
-
55
-
56
-
57
-
58
-
59
-
60
-
61
-
62
-
63
-
64
-
65
-
66
-
67
-
68
-
69
-
70
-
71
-
72
-
73
-
74
-
75
-
76
-
77
-
78
-
79
-
80
-
81
-
82
-
83
-
84
-
85
-
86
-
87
-
88
-
89
-
90
-
91
-
92
-
93
-
94
-
95
-
96
-
97
-
98
-
99
-
100
-
101
-
102
-
103
-
104
-
105
-
106
-
107
-
108
-
109
-
110
-
111
-
112
-
113
-
114
-
115
-
116
-
117
-
118
-
119
-
120
-
121
-
122
-
123
-
124
-
125
-
126
-
127
-
128
-
129
-
130
-
131
-
132
-
133
-
134
 |
 |

BMO Financial Group Annual Report 200416
MD&A
Management’s Discussion and Analysis
Who We Are
BMO Financial Group is one of the largest financial services
providers in North America, offering comprehensive retail
banking, wealth management and investment banking products,
services and solutions.
Canadian clients are served through BMO Bank of Montreal,
our personal and commercial banking business, and BMO
Nesbitt Burns, one of Canada’s leading full-service investment
and wealth management firms. In the United States, clients
are served through Harris, a major Midwest financial services
organization with a network of community banks in the Chicago
area and wealth management offices across the United States,
as well as Harris Nesbitt, a leading mid-market investment
and corporate bank. Our financial service professionals can
provide access to any services our customers require across
the entire enterprise. BMO Financial Group comprises three
client operating groups: Personal and Commercial Client
Group, Private Client Group and Investment Banking Group.
Our Financial Targets
BMO has established an overall governing objective and
medium-term financial objectives as set out in the adjacent chart.
BMO also establishes annual financial targets for certain finan-
cial performance measures, which are also outlined in the chart.
Our success in achieving our overall governing objective of
first-quartile total shareholder return is dependent on achieving
our minimum medium-term financial objectives and on the
relative performance of our peer group.
Annual financial targets represent checkpoints in the
achievement of our medium-term financial objectives. They
reflect economic conditions prevailing at the time and may
be influenced by results in base years used for comparison
purposes. As such, in any particular year they may be higher
or lower than the medium-term financial objectives.
Our operating philosophy is to increase revenues at higher
rates than general economic growth rates, while limiting expense
growth to achieve productivity improvements of 150 to 200 basis
points per year, over time. In achieving efficiencies in expense
management, we balance current profitability with the need
to invest for future growth. When possible, expense efficiencies
partially or totally fund the costs of investing for the future.
In 2004, as in 2003, we achieved all five of our financial targets.
Our targets for 2005 have been established in the context of
our expectations for the economy in the year ahead, as detailed
on page 22, and with regard to the strong results achieved in 2004.
Our Vision
To be the top-performing Canada-U.S. financial services company.
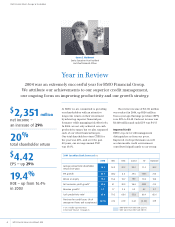
2004 Financial
Targets
2004 Financial
Performance
Target
Met
2005 Financial
Targets
10% to 15%
EPS growth
EPS growth of
29% to $4.42.
Excluding a
$170 million
reduction of
the general
allowance,
EPS rose 22%
to $4.21.
✔
3% to 8% (1)
EPS growth
from a base of
$4.21 (excluding
changes in
the general
allowance)
ROE of 16%
to 18%
ROE of 19.4% ✔ROE of 17%
to 18%
Provision for
credit losses
of $500 million
or less
Specific provision
for credit losses of
$67 million. We
also reduced the
general allowance
by $170 million.
✔
Specific provision
for credit losses
of $400 million
or less
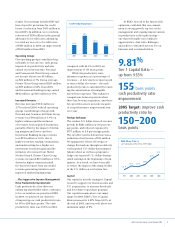
Tier 1 Capital
Ratio of at
least 8.0%
Tier 1 Capital
Ratio of 9.81% ✔
Tier 1 Capital
Ratio of at
least 8.0%
Improve cash
productivity ratio
by 150 to
200 bps
Cash productivity
ratio improved
by 155 bps ✔
Improve our cash
productivity ratio
by 150 to
200 bps
Our Governing Objective
To maximize the total return to BMO shareholders and generate, over
time, first-quartile total shareholder return relative to our Canadian and
North American peer groups.
Our Medium-Term Financial Objectives
To increase EPS by a minimum of 10% per year over time; to earn ROE
of between 18% and 19% over time; and to maintain a strong regulatory
capital position, consistent with our peers.
Regulatory Filings
Our continuous disclosure materials, including our interim filings, annual MD&A and audited consolidated financial statements, our Annual Information Form
and the Notice of Annual Meeting of Shareholders and Proxy Circular are available on our web site at www.bmo.com, on the Canadian Securities Administrators’
web site at www.sedar.com and on the EDGAR section of the SEC’s web site at www.sec.gov. BMO’s CEO and CFO each certify the appropriateness and fairness
of BMO’s annual and interim filings of continuous disclosure materials.
(1) The EPS growth target in 2005 is lower due to our expectation that provisions for credit losses
will return to more normalized levels.