Ameriprise 2015 Annual Report Download - page 4
Download and view the complete annual report
Please find page 4 of the 2015 Ameriprise annual report below. You can navigate through the pages in the report by either clicking on the pages listed below, or by using the keyword search tool below to find specific information within the annual report.-
 1
1 -
 2
2 -
 3
3 -
 4
4 -
 5
5 -
 6
6 -
 7
7 -
 8
8 -
 9
9 -
 10
10 -
 11
11 -
 12
12 -
 13
13 -
 14
14 -
 15
15 -
16
-
17
-
18
-
19
-
20
-
21
-
22
-
23
-
24
-
25
-
26
-
27
-
28
-
29
-
30
-
31
-
32
-
33
-
34
-
35
-
36
-
37
-
38
-
39
-
40
-
41
-
42
-
43
-
44
-
45
-
46
-
47
-
48
-
49
-
50
-
51
-
52
-
53
-
54
-
55
-
56
-
57
-
58
-
59
-
60
-
61
-
62
-
63
-
64
-
65
-
66
-
67
-
68
-
69
-
70
-
71
-
72
-
73
-
74
-
75
-
76
-
77
-
78
-
79
-
80
-
81
-
82
-
83
-
84
-
85
-
86
-
87
-
88
-
89
-
90
-
91
-
92
-
93
-
94
-
95
-
96
-
97
-
98
-
99
-
100
-
101
-
102
-
103
-
104
-
105
-
106
-
107
-
108
-
109
-
110
-
111
-
112
-
113
-
114
-
115
-
116
-
117
-
118
-
119
-
120
-
121
-
122
-
123
-
124
-
125
-
126
-
127
-
128
-
129
-
130
-
131
-
132
-
133
-
134
-
135
-
136
-
137
-
138
-
139
-
140
-
141
-
142
-
143
-
144
-
145
-
146
-
147
-
148
-
149
-
150
-
151
-
152
-
153
-
154
-
155
-
156
-
157
-
158
-
159
-
160
-
161
-
162
-
163
-
164
-
165
-
166
-
167
-
168
-
169
-
170
-
171
-
172
-
173
-
174
-
175
-
176
-
177
-
178
-
179
-
180
-
181
-
182
-
183
-
184
-
185
-
186
-
187
-
188
-
189
-
190
-
191
-
192
-
193
-
194
-
195
-
196
-
197
-
198
-
199
-
200
-
201
-
202
-
203
-
204
-
205
-
206
-
207
-
208
-
209
-
210
 |
 |

2 | Annual Report 2015
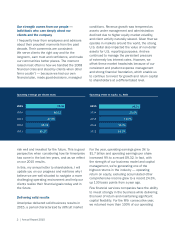
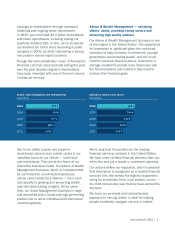
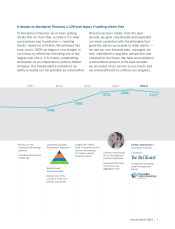
Operating earnings per diluted share
$5.59
$7.05
$8.52
$9.32
$5.17
Operating return on equity, ex. AOCI
Our strength comes from our people —
individuals who care deeply about our
clients and the company
I frequently hear from employees and advisors
about their proudest moments from the past
decade. Their comments are consistent:
We serve clients the right way and for the
long-term, earn trust and condence, and make
our communities better places. The moment
raised most often is how we handled the 2008
nancial crisis and stood by clients when other
rms couldn’t — because we had our own
nancial plan, made good decisions, managed
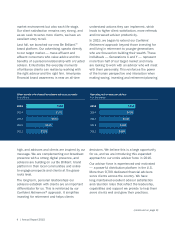
conditions. Revenue growth was tempered as
assets under management and administration
declined due to higher equity market volatility,
and client activity naturally slowed. Given that we
operate in markets around the world, the strong
U.S. dollar also impacted the value of non-dollar
assets for U.S. reporting purposes. And we
continued to manage the persistent pressure
of extremely low interest rates. However, we
offset these market headwinds because of our
consistent and prudent expense management
and strong nancial foundation, which enable us
to continue to invest for growth and return capital
to shareholders at a differentiated level.
risk well and invested for the future. This is good
perspective when considering how far Ameriprise
has come in the last ten years, and as we reect
on our 2015 results.
In this, my annual letter to shareholders, I will
update you on our progress and reinforce why I
believe we are well-situated to navigate a more
challenging operating environment and help our
clients realize their nancial goals today and in
the future.
Delivering solid results
Ameriprise delivered solid business results in
2015, a period characterized by difcult market
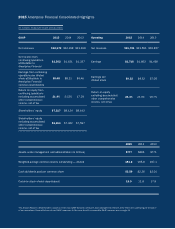
For the year, operating earnings grew 3% to
$1.7 billion and operating earnings per share
increased 9% to a record $9.32. In fact, with
the strength of our business model and capital
management, we’re generating one of the
highest returns in the industry — operating
return on equity, excluding accumulated other
comprehensive income grew to a record 24.3%,
up 130 basis points from a year ago.
Few nancial services companies have the ability
to invest strongly in the business while delivering
this level of return and maintaining signicant
capital exibility. For the fth consecutive year,
we returned more than 100% of our operating
2015
2014
2013
2012
2011
16.2%
19.7%
23.0%
24.3%
16.0%
2015
2014
2013
2012
2011