American Home Shield 2011 Annual Report Download - page 10
Download and view the complete annual report
Please find page 10 of the 2011 American Home Shield annual report below. You can navigate through the pages in the report by either clicking on the pages listed below, or by using the keyword search tool below to find specific information within the annual report.-
 1
1 -
 2
2 -
 3
3 -
 4
4 -
 5
5 -
 6
6 -
 7
7 -
 8
8 -
 9
9 -
 10
10 -
 11
11 -
 12
12 -
 13
13 -
 14
14 -
 15
15 -
 16
16 -
 17
17 -
 18
18 -
 19
19 -
 20
20 -
 21
21 -
22
-
23
-
24
-
25
-
26
-
27
-
28
-
29
-
30
-
31
-
32
-
33
-
34
-
35
-
36
-
37
-
38
-
39
-
40
-
41
-
42
-
43
-
44
-
45
-
46
-
47
-
48
-
49
-
50
-
51
-
52
-
53
-
54
-
55
-
56
-
57
-
58
-
59
-
60
-
61
-
62
-
63
-
64
-
65
-
66
-
67
-
68
-
69
-
70
-
71
-
72
-
73
-
74
-
75
-
76
-
77
-
78
-
79
-
80
-
81
-
82
-
83
-
84
-
85
-
86
-
87
-
88
-
89
-
90
-
91
-
92
-
93
-
94
-
95
-
96
-
97
-
98
-
99
-
100
-
101
-
102
-
103
-
104
-
105
-
106
-
107
-
108
-
109
-
110
-
111
-
112
-
113
-
114
-
115
-
116
-
117
-
118
-
119
-
120
-
121
-
122
-
123
-
124
-
125
-
126
-
127
-
128
-
129
-
130
-
131
-
132
-
133
-
134
-
135
-
136
-
137
-
138
-
139
-
140
-
141
-
142
-
143
-
144
-
145
-
146
-
147
-
148
-
149
-
150
-
151
-
152
-
153
-
154
-
155
-
156
-
157
-
158
-
159
-
160
-
161
-
162
-
163
-
164
-
165
-
166
-
167
-
168
-
169
-
170
-
171
-
172
-
173
-
174
-
175
-
176
-
177
-
178
-
179
-
180
-
181
-
182
-
183
-
184
-
185
-
186
-
187
-
188
-
189
-
190
-
191
-
192
-
193
-
194
-
195
-
196
-
197
-
198
-
199
-
200
-
201
-
202
-
203
-
204
-
205
-
206
-
207
-
208
-
209
-
210
-
211
-
212
-
213
-
214
-
215
-
216
-
217
-
218
-
219
-
220
 |
 |

Table of Contents
ServiceMaster family of brands, including our franchisees. No single customer represents a material portion of our consolidated revenue base, and
our segments are not dependent on a single customer or a few customers who are provided with services and products by the ServiceMaster family
of brands, including our franchisees. We believe that our historical ability to increase Adjusted EBITDA results from technology investments that
have driven efficiency within the Terminix segment, tighter controls that have allowed us to closely manage costs and the efficient use of our
support centers, which utilize our combined scale and capabilities across our business segments. See Item 7, Management's Discussion and
Analysis of Financial Condition and Results of Operations—Segment Review for a discussion of how we calculate Adjusted EBITDA.
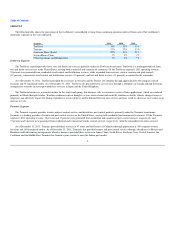
Strong and stable customer retention rates. The customers in our three largest segments typically enter into one-year service programs, which
are renewable annually. Our customer retention rates were approximately 66.7 percent for TruGreen, 80.6 percent for Terminix Pest Control,
86.1 percent for Terminix Termite and 75.1 percent for American Home Shield for the year ended December 31, 2011. We have generally been
able either to grow or sustain customer retention rates in our core business units through the recent economic downturn, contributing to the
stability of our overall revenue base.
Improved cost structure under private ownership. Since becoming a private company in 2007, we have improved our cost structure across our
businesses. For example, the cost structure of Terminix has benefited from a branch optimization initiative, including adherence to branch
operating models, sharing best practices and more efficient sourcing of labor and materials. We have also deployed technology and mobility
solutions in the Terminix business, including handheld technologies designed to enhance technician efficiency and reduce operating costs, and
have improved mobility and technology solutions across other business units to drive increased efficiencies.
Strong cash flow profile. Our company has historically generated significant operating cash flow. Our average Adjusted EBITDA for the last three
years was $536 million, and our average capital expenditures over the same period were $96 million. We have been able to manage our working capital needs,
principally through lower inventory requirements and increased customer prepayment initiatives in several of our businesses.
STRATEGY
Our strategy is focused on the following strategic priorities:
Rapid, profitable growth:
Enhance customer experience and improve customer retention. We seek to grow operating revenue through initiatives designed to enhance
customer satisfaction and loyalty. Key objectives include the optimization of customer-employee contact and communication, enhanced use of
customer relationship management software for scheduling and work order management, continued improvement of quality of services delivered
through better training, faster problem resolution and increased transfer of best practices across our businesses.
Expand commercial services. We believe that our extensive national coverage, brand strength and broad product and service offerings provide us
with a significant competitive advantage for serving multi-location commercial accounts, especially compared to local and regional competitors.
We believe that we have the opportunity to further utilize our competitive advantages with our broad national service network to increase our
delivery of services to commercial accounts. Our specific strategies include accelerating national account growth by adding sales resources and
enhancing our value proposition through
8
•
•
•
•