Alpine 2011 Annual Report Download - page 4
Download and view the complete annual report
Please find page 4 of the 2011 Alpine annual report below. You can navigate through the pages in the report by either clicking on the pages listed below, or by using the keyword search tool below to find specific information within the annual report.-
 1
1 -
 2
2 -
 3
3 -
 4
4 -
 5
5 -
 6
6 -
 7
7 -
 8
8 -
 9
9 -
 10
10 -
 11
11 -
 12
12 -
 13
13 -
 14
14 -
 15
15 -
16
-
17
-
18
-
19
-
20
-
21
-
22
-
23
-
24
-
25
-
26
-
27
-
28
-
29
-
30
-
31
-
32
-
33
-
34
-
35
-
36
-
37
-
38
 |
 |

4
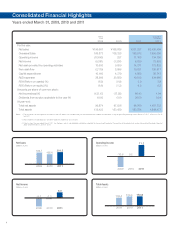
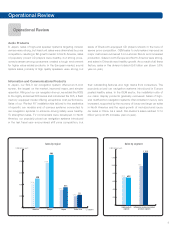
Consolidated Financial Highlights
For the year:
Net sales
Overseas Sales
Operating income
Net income
Net cash provided by operating activities
Free cash flow
Capital expenditures
R&D expenses
ROA (Return on assets) (%)
ROE (Return on equity) (%)
Amounts per share of common stock:
Net income(loss) (¥)
Dividends from surplus applicable to the year (¥)
At year-end:
Total net assets
Total assets
2010
¥168,586
138,335
227
(1,250)
9,859
5,896
4,379
20,589
(0.9)
(1.3)
(17.92)
0.00
97,036
153,429
2009
¥196,667
166,873
(10,645)
(9,291)
10,680
(2,170)
10,160
28,266
(6.2)
(8.8)
(133.17)
10.00
96,874
132,423
millions
of yen
2011
$2,420,409
1,996,055
134,155
72,520
172,832
120,517
58,713
234,660
3.9
6.2
1.04
0.24
1,187,733
1,849,477
thousands of
U.S.Dollars
2011
¥201,257
165,972
11,155
6,030
14,371
10,021
4,882
19,512
3.9
6.2
86.43
20.00
98,760
153,784
1. The translations of the Japanese yen amounts into U.S. dollars are included solely for the convenience of readers outside Japan, using the prevailing exchange rate at March 31, 2011, which was ¥83.15
to U.S.$1.
2. R&D expenses include labor cost and other expenses reported as cost of sales.
3. Effective from the year ended March, 2011, the Company and its consolidated subsidiaries adopted the Accounting Standard of Presenation of Comprehensive income (Accounting Standards Board of
Japan Statement No.25, June 30, 2010).
Notes:
Years ended March 31, 2009, 2010 and 2011
Net Sales
(Billions of yen)
196.7
2009 2010 2011
168.6 201.3
Total Assets
(Billions of yen)
2009 2010 2011
153.8
153.4
132.4
-9.3
2009 2010 2011
-1.3
6.0
Net Income
(Billions of yen)
Operating Income
(Billions of yen)
2009 2010 2011
11.2
0.2-10.6