Alpine 2011 Annual Report Download - page 15
Download and view the complete annual report
Please find page 15 of the 2011 Alpine annual report below. You can navigate through the pages in the report by either clicking on the pages listed below, or by using the keyword search tool below to find specific information within the annual report.-
 1
1 -
2
-
3
-
4
-
 5
5 -
 6
6 -
 7
7 -
 8
8 -
 9
9 -
 10
10 -
 11
11 -
 12
12 -
 13
13 -
 14
14 -
 15
15 -
 16
16 -
 17
17 -
 18
18 -
 19
19 -
 20
20 -
 21
21 -
 22
22 -
 23
23 -
 24
24 -
 25
25 -
26
-
27
-
28
-
29
-
30
-
31
-
32
-
33
-
34
-
35
-
36
-
37
-
38
 |
 |

15
commercial to stimulate consumer spending.
Sales of our affordably priced navigation systems that were newly launched into the North
American market were strong, thanks to customer appreciation of the superior functionality,
despite being affected by increasingly severe price competition. In Europe, sales of integrated
products were lower due to the impact of worsening market conditions, but sales of affordably
priced navigation systems introduced during the term were robust.
In OEM products to automobile manufacturers, installation rates of in-cabin display products
contributed to increased unit sales. Such sales were also boosted by a continuing recovery
in production and sales of large and high-end vehicles in North America, which have high
installation rates for highly functional products such as navigation systems, and favorable
sales of high-end new vehicles by European manufacturers in the Chinese market.
As a result of the above factors, segment sales increased by 33.9% year on year, to ¥131,359
million (US$ 1,579.8 million).
The number of consolidated subsidiaries is 27 companies, with 8 companies in Japan and 19
overseas. The number of companies accounted for by the equity method at the end of the
fiscal year is 1.
Investment
Capital expenditures decreased by 11.5% to ¥4,882 million (US$58.7 million). By segment,
investment in the Audio Products business totaled ¥2,012 million (US$24.2 million), and
that in the Information and Communication Equipment business amounted to ¥2,864 million
(US$34.4 million).
R&D expenses decreased by 5.2% to ¥19,512 million (US$234.7 million). R&D expenses
amounted to 9.7% of net sales, down 2.5 percentage points.
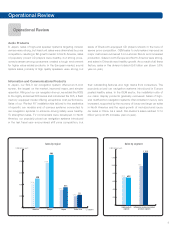
Cash Flows
For the fiscal year under review, cash and cash equivalents at the end of the period totaled
¥43,884 million (US$527.8 million), a increase of ¥4,040 million (US$48.6 million), or 10.1%,
compared with the previous fiscal year-end.
Cash flows from operating activities
Net cash provided by operating activities amounted to ¥14,371 million (US$172.8 million),
an increase of 45.8%. This was mainly the result of inflows provided by Income before
income taxes and minority interests of ¥8,510 million (US$102.3 million), depreciation and
amortization of ¥7,442 million (US$89.5 million), increase in notes and accounts payable-trade
of ¥1,424 million (US$17.1 million), increase in notes and accounts receivable-trade of ¥1,395
million (US$16.8 million), and increase in inventories of ¥5,010 million (US$60.3 million),.
Cash flows from investing activities
Net cash used in investing activities was ¥4,350 million (US$52.3 million), up 9.8% compared
with the previous fiscal year. Principal components were payments for the purchase of
property, plant and equipment of ¥3,708 million (US$44.6 million) and for the purchase of
intangible assets of ¥1,255 million (US$15.1 million).
Cash flows from financing activities
Net cash used in financing activities totaled ¥5,411 million (US$65.1 million), compared to
the net cash provided with ¥8,150 million in the previous fiscal year. The principal component
was repayment of long-term loans payable of ¥4,602 million (US$55.3 million) and payment of
cash dividends of ¥698 million (US$8.4 million).
Financial Position
Total assets at the end of the year increased by 0.2% to ¥153,784 million (US$1,849.5
million), due to an increase in cash and cash equivalents, inventories, and due to a decrease
in property, plant and equipment, and investments. As a result of the increase in retained
earnings and decrease in valuation difference on available-for-sale securities and in foreign
currency translation adjustment, total net assets increased by 1.8% to ¥98,760 million
(US$1,187.7 million). The equity ratio increased by 1.0 percentage points to 63.7%.
Return on equity was 6.2%. Return on assets was 3.9%.
Cash Flows
(Millions of Yen)
9,859
5,896
14,371
10,021
2011
16,399
4,512
9,963
(4,138)
10,680
(2,170)
Net cash provided by operating activities
Free Cash Flow
2007 2008 2009 2010
Return on Equity/Return on Assets
(%)
(0.9)
(1.3)
3.9
6.2
2011
5.0
3.3
(6.2)
3.0
(8.8)
2.0
Return on Equity
Ruturn on Assets
2007 2008 2009 2010
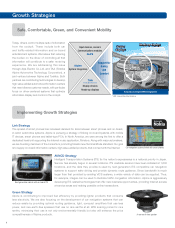
Cash Dividends
(¥)
20.00
2011
25.0
10.0
0.0
25.0
2007 2008 2009 2010