Alpine 2011 Annual Report Download - page 13
Download and view the complete annual report
Please find page 13 of the 2011 Alpine annual report below. You can navigate through the pages in the report by either clicking on the pages listed below, or by using the keyword search tool below to find specific information within the annual report.-
 1
1 -
2
-
 3
3 -
 4
4 -
 5
5 -
 6
6 -
 7
7 -
 8
8 -
 9
9 -
 10
10 -
 11
11 -
 12
12 -
 13
13 -
 14
14 -
 15
15 -
 16
16 -
 17
17 -
 18
18 -
 19
19 -
 20
20 -
 21
21 -
 22
22 -
 23
23 -
24
-
25
-
26
-
27
-
28
-
29
-
30
-
31
-
32
-
33
-
34
-
35
-
36
-
37
-
38
 |
 |

13
Thousands of
U.S.Dollars
2007 2008 2009 2010 2011 2011
For the year:
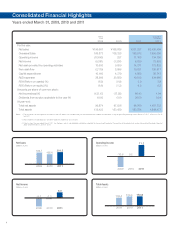
Net sales 265,055 252,072 196,667 168,586 201,257 2,420,409
(Overseas Sales) 228,379 219,056 166,873 138,335 165,972 1,996,055
Operating income(loss) 10,110 7,012 (10,645) 227 11,155 134,155
Net income(loss) 5,729 3,554 (9,291) (1,250) 6,030 72,520
Comprehensive income – – – – 2,383 28,659
Net cash provided by
operating activities 16,399 9,963 10,680 9,859 14,371 172,832
Free cash flow 4,512 (4,138) (2,170) 5,896 10,021 120,517
Depreciation 9,326 10,655 10,336 8,352 7,442 89,501
Capital expenditures 12,620 13,673 10,160 4,379 4,882 58,713
R&D expenses 30,347 29,337 28,266 20,589 19,512 234,660
ROA (Return on assets) (%) 3.3 2.0 (6.2) (0.9) 3.9 3.9
ROE (Return on equity) (%) 5.0 3.0 (8.8) (1.3) 6.2 6.2
At year-end:
Current assets 114,938 103,756 75,134 96,185 102,931 1,237,896
Total Property, plant and equipment
30,090 32,851 28,903 25,875 22,042 265,087
Current liabilities 53,763 48,265 30,499 39,306 42,183 507,312
Noncurrent liabilities 6,514 3,255 5,050 17,087 12,841 154,432
Capital stock 25,921 25,921 25,921 25,921 25,921 311,738
Retained earnings 57,344 58,592 47,839 46,550 51,797 622,935
Total shareholders' equity – – – – ––
Total net assets 120,908 116,265 96,874 97,036 98,760 1,187,733
Total assets 181,185 167,785 132,423 153,429 153,784 1,849,477
Equity ratio (%) 65.7 68.5 72.4 62.7 63.7 63.7
Amounts per share of common stock:
Net income(loss) (¥) 82.12 50.95 (133.17) (17.92) 86.43 1.04
Diluted net income (¥) – – – – ––
Dividends from surplus
applicable to the year (¥) 25.00 25.00 10.00 0.00 20.00 0.24
Shareholders' equity (¥) 1,706.54 1,646.38 1,374.95 1,379.61 1,403.69 16.88