Alpine 2009 Annual Report Download - page 3
Download and view the complete annual report
Please find page 3 of the 2009 Alpine annual report below. You can navigate through the pages in the report by either clicking on the pages listed below, or by using the keyword search tool below to find specific information within the annual report.-
 1
1 -
 2
2 -
 3
3 -
 4
4 -
 5
5 -
 6
6 -
 7
7 -
 8
8 -
 9
9 -
 10
10 -
 11
11 -
 12
12 -
 13
13 -
 14
14 -
15
-
16
-
17
-
18
-
19
-
20
-
21
-
22
-
23
-
24
-
25
-
26
-
27
-
28
-
29
-
30
-
31
-
32
-
33
-
34
-
35
-
36
 |
 |

3
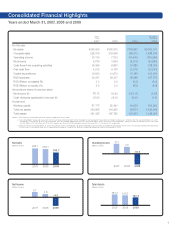
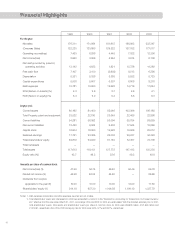
Consolidated Financial Highlights
For the year
Net sales
Overseas sales
Operating income
Net income
Cash flows from operating activities
Free cash flow
Capital expenditures
R&D expenses
ROA (Return on assets) (%)
ROE (Return on equity) (%)
Amounts per share of common stock
Net income (¥)
Cash dividends applicable to the year (¥)
At year-end
Working capital
Total net assets
Total assets
2008
¥252,072
219,056
7,012
3,554
9,963
-4,138
13,673
29,337
2.0
3.0
50.95
25.00
55,491
116,265
167,785
2007
¥265,055
228,379
10,110
5,729
16,399
4,512
12,620
30,347
3.3
5.0
82.12
25.00
61,175
120,908
181,185
millions
of yen
2009
$2,002,107
1,698,799
(108,368)
(94,584)
108,724
(22,091)
103,431
287,753
(6.2)
(8.8)
(1.36)
0.10
454,393
1,160,445
1,348,091
thousands of
U.S.Dollars
2009
¥196,667
166,873
(10,645)
(9,291)
10,680
(2,170)
10,160
28,266
(6.2)
(8.8)
(133.17)
10.00
44,635
96,874
132,423
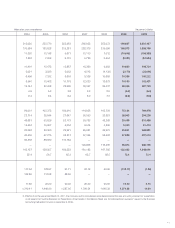
1. R&D expenses include labor and other expenses reported as cost of sales.
2. Total shareholders' equity and total assets for 2000 are reclassified to conform to the "Standard for Accounting for Transactions by Foreign Currency, etc." effective from the year ended March 31, 2001.
Accordingly, ROA and ROE for 2000 are recalculated. With the standard adopted prior to 2001, total shareholders' equity, total assets and shareholders' equity per share of common stock for 2000 were
¥58,533 million, ¥121,694 million and ¥1,019.91, respectively. Also, ROA, ROE and equity ratio for 2000 were 2.6%, 5.7% and 48.1%, respectively.
3. Effective from the year ended March 31, 2007, the Company and its consolidated subsidiaries adopted the new accounting standard for presentation of net assets ("Accounting Standard for Presentation
of Net Assets in the Balance Sheet and its Implementation Guidance" issued by the Business Accounting Deliberation Council on December 9, 2005).
Notes:
Years ended March 31, 2007, 2008 and 2009
Net Sales
(Billions of yen)
0
80
160
240
320
400
2007 2008 2009
196.7
252.1
26 5.1
Total Assets
(Billions of yen)
0
100
200
300
400
132.4
167. 8
181.2
2007 2008 2009
-20.00
-16.75
-13.50
-10.25
-7.00
-3.75
-0.50
2.75
6.00
Net Income
(Billions of yen)
-9.3
3.6
5.7
2007 2008 2009
Operating Income
(Billions of yen)
-12000
-7200
-2400
2400
7200
12000
-10.6
7.0
10.1
2007 2008 2009