Alpine 2009 Annual Report Download - page 11
Download and view the complete annual report
Please find page 11 of the 2009 Alpine annual report below. You can navigate through the pages in the report by either clicking on the pages listed below, or by using the keyword search tool below to find specific information within the annual report.-
 1
1 -
 2
2 -
 3
3 -
 4
4 -
 5
5 -
 6
6 -
 7
7 -
 8
8 -
 9
9 -
 10
10 -
 11
11 -
 12
12 -
 13
13 -
 14
14 -
 15
15 -
 16
16 -
 17
17 -
 18
18 -
 19
19 -
 20
20 -
 21
21 -
 22
22 -
23
-
24
-
25
-
26
-
27
-
28
-
29
-
30
-
31
-
32
-
33
-
34
-
35
-
36
 |
 |

11
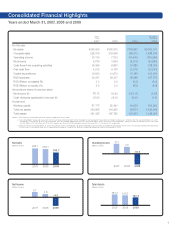
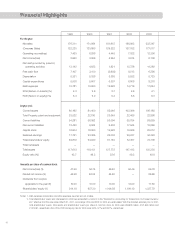
Millions of Yen, unless stated otherwise Thousands of U.S Dollars
1999 2000 2001 2002 2003 2004 2005 2006 2007 2008 2009 2009
Net sales 176,311 171,084 181,615 196,092 222,367 213,020 222,779 253,983 265,055 252,072 196,667 2,002,107
(Overseas Sales) 122,220 123,893 129,522 157,032 177,017 170,984 180,828 215,281 228,379 219,056 166,873 1,698,799
Operating income(loss) 7,453 6,298 4,445 7,022 12,306 11,320 10,148 9,671 10,110 7,012 (10,645) (108,368)
Net income(loss) 2,650 3,098 3,284 3,914 6,138 7,253 7,932 6,175 5,729 3,554 (9,291) (94,584)
Net cash provided by (used in)
operating activities 13,142 4,622 1,921 15,728 14,389 10,491 12,472 12,887 16,399 9,963 10,680 108,724
Free cash flow 7,107 3,100 (3,602) 8,513 6,290 3,021 3,229 3,032 4,512 (4,138) (2,170) (22,091)
Depreciation 5,351 5,338 5,385 5,552 5,723 6,496 7,332 8,616 9,326 10,655 10,336 105,222
Capital expenditures 5,008 5,607 6,307 6,808 8,218 8,940 10,402 10,778 12,620 13,673 10,160 103,431
R&D expenses 10,781 10,990 12,628 14,718 17,644 19,144 22,438 28,695 30,347 29,337 28,266 287,753
ROA (Return on assets) (%) 2.3 2.6 2.7 2.8 4.1 4.9 5.3 3.8 3.3 2.0 (6.2) (6.2)
ROE (Return on equity) (%) 5.4 5.9 5.4 5.6 8.3 9.4 9.4 6.2 5.0 3.0 (8.8) (8.8)
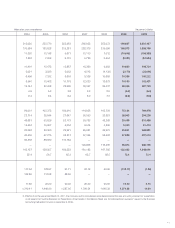
Current assets 80,165 81,400 85,046 102,396 106,180 99,031 105,372 109,910 114,938 103,756 75,134 764,878
Total Property, plant and equipment 23,022 22,810 23,649 22,466 22,898 22,714 25,544 27,647 30,090 32,851 28,903 294,238
Current liabilities 54,281 56,092 53,094 55,754 58,669 48,681 50,826 52,173 53,763 48,265 30,499 310,485
Noncurrent liabilities 12,420 6,005 6,403 17,944 15,869 15,534 15,807 5,004 6,514 3,255 5,050 51,410
Capital stock 16,904 18,090 19,928 19,928 20,012 20,026 20,360 25,921 25,921 25,921 25,921 263,881
Retained earnings 17,721 23,365 26,002 29,247 34,393 40,500 47,275 52,213 57,344 58,592 47,839 487,010
Total shareholders' equity 49,879 54,940 67,145 72,467 74,738 80,336 88,830 110,782 — — — —
Total net assets — — — — — — — — 120,908 116,265 96,874 986,196
Total assets 117,613 118,101 127,772 147,412 150,230 145,127 156,507 169,553 181,185 167,785 132,423 1,348,091
Equity ratio (%) 42.7 46.5 52.6 49.2 49.8 55.4 56.7 65.3 65.7 68.5 72.4 72.4
Net income(loss) (¥) 47.96 54.74 56.40 64.49 99.78 117.94 128.97 91.71 82.12 50.95 (133.17) (1.36)
Diluted net income (¥) 44.98 52.04 54.60 — 86.86 102.85 112.58 88.35 — — — —
Dividends from surplus
applicable to the year (¥) 10.00 10.00 10.00 12.50 17.50 17.50 20.00 20.00 25.00 25.00 10.00 0.10
Shareholders' equity (¥) 914.18 957.30 1,106.38 1,194.19 1,227.79 1,319.41 1,446.99 1,587.05 1,706.54 1,646.38 1,374.95 14.00
3. Effective from the year ended March 31, 2007, the Company and its consolidated subsidiaries adopted the new accounting standard for presentation
of net assets ("Accounting Standard for Presentation of Net Assets in the Balance Sheet and its Implementation Guidance" issued by the Business
Accounting Deliberation Council on December 9, 2005).