Air New Zealand 2010 Annual Report Download - page 4
Download and view the complete annual report
Please find page 4 of the 2010 Air New Zealand annual report below. You can navigate through the pages in the report by either clicking on the pages listed below, or by using the keyword search tool below to find specific information within the annual report.-
 1
1 -
 2
2 -
 3
3 -
 4
4 -
 5
5 -
 6
6 -
 7
7 -
 8
8 -
 9
9 -
 10
10 -
 11
11 -
 12
12 -
 13
13 -
 14
14 -
 15
15 -
16
-
17
-
18
-
19
-
20
-
21
-
22
-
23
-
24
-
25
-
26
-
27
-
28
-
29
-
30
-
31
-
32
-
33
-
34
-
35
-
36
-
37
-
38
-
39
-
40
-
41
-
42
-
43
-
44
-
45
-
46
-
47
-
48
-
49
-
50
-
51
-
52
-
53
-
54
-
55
-
56
-
57
-
58
-
59
-
60
-
61
-
62
-
63
-
64
-
65
-
66
-
67
-
68
-
69
-
70
-
71
-
72
-
73
-
74
-
75
-
76
 |
 |

NOTES
GROUP
2010
$M
GROUP
2009
$M
COMPANY
2010
$M
COMPANY
2009
$M
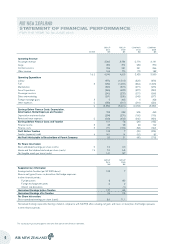
Operating Revenue
Passenger revenue 3,305 3,734 2,776 3,191
Cargo 255 374 250 370
Contract services 322 331 241 256
Other revenue 164 170 172 182
1 & 2 4,046 4,609 3,439 3,999
Operating Expenditure
Labour (976) (1,019) (822) (878)
Fuel 3 (939) (1,687) (864) (1,593)
Maintenance (326) (327) (271) (276)
Aircraft operations (369) (423) (297) (343)
Passenger services (240) (275) (231) (268)
Sales and marketing (261) (295) (243) (277)
Foreign exchange gains 3 6 366 4 358
Other expenses 2 (233) (261) (210) (253)
2 (3,338) (3,921) (2,934) (3,530)
Earnings Before Finance Costs, Depreciation,
Amortisation, Rental Expenses and Taxation 708 688 505 469
Depreciation and amortisation (294) (276) (180) (175)
Rental and lease expenses 2 (263) (334) (345) (459)
Earnings Before Finance Costs and Taxation 151 78 (20) (165)
Finance income 3 43 98 48 102
Finance costs 3 (71) (169) (58) (142)
Profit Before Taxation 123 7 (30) (205)
Taxation (expense)/credit 4 (41) 14 (15) 87
Net Profit Attributable to Shareholders of Parent Company 82 21 (45) (118)
Per Share Information:
Basic and diluted earnings per share (cents) 5 7.6 2.0
Interim and final dividend declared per share (cents) 19 7.0 6.5
Net tangible assets per share (cents) 141 147
GROUP
2010
$M
GROUP
2009
$M
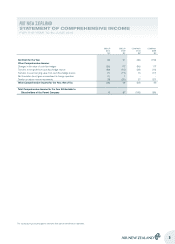
Supplementary Information
Earnings before Taxation (per NZ IFRS above) 123 7
Reverse net (gains)/losses on derivatives that hedge exposures
in other financial periods:
Fuel derivatives 8 130
Foreign exchange derivatives 6 9
Interest rate derivatives - (1)
Normalised Earnings before Taxation 137 145
Normalised Earnings after Taxation 92 118
Per Share Information:
Basic normalised earnings per share (cents) 8.6 11.1
Normalised Earnings represents Earnings stated in compliance with NZ IFRS after excluding net gains and losses on derivatives that hedge exposures
in other financial periods.
The accompanying accounting policies and notes form part of these financial statements.
2
AIR NEW ZEALAND
STATEMENT OF FINANCIAL PERFORMANCE
FOR THE YEAR TO 30 JUNE 2010