Air New Zealand 2010 Annual Report Download - page 22
Download and view the complete annual report
Please find page 22 of the 2010 Air New Zealand annual report below. You can navigate through the pages in the report by either clicking on the pages listed below, or by using the keyword search tool below to find specific information within the annual report.-
 1
1 -
2
-
3
-
4
-
5
-
6
-
7
-
8
-
9
-
10
-
11
-
 12
12 -
 13
13 -
 14
14 -
 15
15 -
 16
16 -
 17
17 -
 18
18 -
 19
19 -
 20
20 -
 21
21 -
 22
22 -
 23
23 -
 24
24 -
 25
25 -
 26
26 -
 27
27 -
 28
28 -
 29
29 -
 30
30 -
 31
31 -
 32
32 -
33
-
34
-
35
-
36
-
37
-
38
-
39
-
40
-
41
-
42
-
43
-
44
-
45
-
46
-
47
-
48
-
49
-
50
-
51
-
52
-
53
-
54
-
55
-
56
-
57
-
58
-
59
-
60
-
61
-
62
-
63
-
64
-
65
-
66
-
67
-
68
-
69
-
70
-
71
-
72
-
73
-
74
-
75
-
76
 |
 |

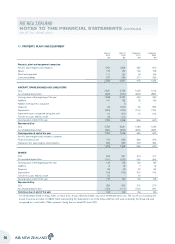
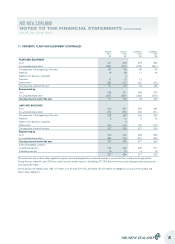
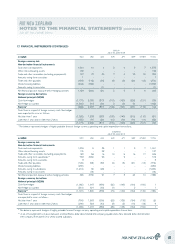
11. PROPERTY, PLANT AND EQUIPMENT
GROUP
2010
$M
GROUP
2009
$M
COMPANY
2010
$M
COMPANY
2009
$M
Property, plant and equipment comprises:
Aircraft, spare engines and simulators 1,759 1,828 555 600
Spares 133 149 109 123
Plant and equipment 111 124 94 105
Land and buildings 227 236 217 226
2,230 2,337 975 1,054
AIRCRAFT, SPARE ENGINES AND SIMULATORS
Cost 2,631 2,735 1,023 1,012
Accumulated depreciation (803) (699) (423) (382)
Carrying value at the beginning of the year 1,828 2,036 600 630
Additions 161 182 78 129
Addition from business acquisition - 3 - -
Disposals (6) (102) (6) (39)
Depreciation (220) (198) (116) (106)
Impairment losses recognised during the year* (1) (81) (1) (14)
Transfer to assets held for resale (3) (12) - -
Carrying value at end of the year 1,759 1,828 555 600
Represented by:
Cost 2,740 2,631 1,053 1,023
Accumulated depreciation (981) (803) (498) (423)
Carrying value at end of the year 1,759 1,828 555 600
Aircraft, spare engines and simulators comprise:
Finance leased aircraft 774 835 256 276
Owned aircraft, spare engines and simulators 985 993 299 324
1,759 1,828 555 600
SPARES
Cost 260 261 219 217
Accumulated depreciation (111) (103) (96) (84)
Carrying value at the beginning of the year 149 158 123 133
Additions 8 18 7 12
Disposals (5) (9) (5) (8)
Depreciation (18) (18) (15) (14)
Transfer to assets held for resale (1) - (1) -
Carrying value at end of the year 133 149 109 123
Represented by:
Cost 256 260 215 219
Accumulated depreciation (123) (111) (106) (96)
Carrying value at end of the year 133 149 109 123
* On 28 November 2008 an Airbus A320, on lease to XL Airways Germany GmbH, was lost in the Mediterranean sea. The aircraft was insured by the
lessee. Insurance proceeds of US$43 million (representing the replacement cost of the Airbus A320 aircraft) were received by the Group and were
recognised as a credit within “Other expenses” during the year ended 30 June 2009.
AIR NEW ZEALAND
NOTES TO THE FINANCIAL STATEMENTS (CONTINUED)
AS AT 30 JUNE 2010
20