Air New Zealand 2010 Annual Report Download - page 19
Download and view the complete annual report
Please find page 19 of the 2010 Air New Zealand annual report below. You can navigate through the pages in the report by either clicking on the pages listed below, or by using the keyword search tool below to find specific information within the annual report.-
 1
1 -
2
-
3
-
4
-
5
-
6
-
7
-
8
-
 9
9 -
 10
10 -
 11
11 -
 12
12 -
 13
13 -
 14
14 -
 15
15 -
 16
16 -
 17
17 -
 18
18 -
 19
19 -
 20
20 -
 21
21 -
 22
22 -
 23
23 -
 24
24 -
 25
25 -
 26
26 -
 27
27 -
 28
28 -
 29
29 -
30
-
31
-
32
-
33
-
34
-
35
-
36
-
37
-
38
-
39
-
40
-
41
-
42
-
43
-
44
-
45
-
46
-
47
-
48
-
49
-
50
-
51
-
52
-
53
-
54
-
55
-
56
-
57
-
58
-
59
-
60
-
61
-
62
-
63
-
64
-
65
-
66
-
67
-
68
-
69
-
70
-
71
-
72
-
73
-
74
-
75
-
76
 |
 |

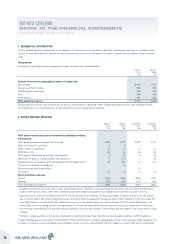
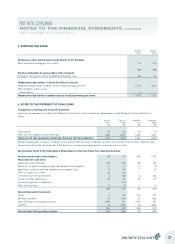
5. EARNINGS PER SHARE
GROUP
2010
GROUP
2009
Earnings per share attributable to equity holders of the Company
Basic and diluted earnings per share (cents) 7.6 2.0
$M $M
Earnings attributable to equity holders of the Company
Earnings for the purpose of basic and diluted earnings per share 82 21
Weighted average number of shares (in millions of shares)
Weighted average number of ordinary shares for basic earnings per share 1,073 1,061
Effect of dilutive ordinary shares:
- Share options 3 -
Weighted average number of ordinary shares for diluted earnings per share 1,076 1,061
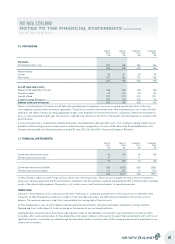
6. NOTES TO THE STATEMENT OF CASH FLOWS
Composition of closing cash and cash equivalents
Cash and cash equivalents, as stated in the Statement of Cash Flows, are reconciled to the related balances in the Statement of Financial Position as
follows:
GROUP
2010
$M
GROUP
2009
$M
COMPANY
2010
$M
COMPANY
2009
$M
Cash balances 35 26 29 19
Other short term deposits and short term bills 1,032 1,547 1,032 1,547
Total cash and cash equivalents (comprising “Bank and short term deposits”) 1,067 1,573 1,061 1,566
Receipts and payments in respect of funding to/from related parties have been combined to present a net cash flow in the Company. Given the large
amounts involved and the short maturities of the deals, it is considered more appropriate to present these flows as net.
Reconciliation of Net Profit Attributable to Shareholders to Net Cash Flows from Operating Activities:
Net profit attributable to shareholders 82 21 (45) (118)
Plus/(less) non-cash items:
Depreciation and amortisation 294 276 180 175
(Gain)/loss on disposal of property, plant and equipment and intangibles (1) 11 (1) 8
Impairment of property, plant and equipment and intangible assets 3 81 1 14
Share of surplus of associates (6) (3) - -
Unrealised losses on fuel derivatives 8 130 8 130
Foreign exchange (gain)/losses (6) 36 (6) 34
Discount on aquisition of subsidiaries - (10) - -
Other non-cash items 11 8 1 6
385 550 138 249
Net working capital movements:
Assets 5 83 (19) 157
Revenue in advance 67 (96) 59 (98)
Deferred foreign exchange (gains)/losses (137) 131 (137) 131
Liabilities 14 (182) 39 (209)
(51) (64) (58) (19)
Net cash flow from operating activities 334 486 80 230
AIR NEW ZEALAND
NOTES TO THE FINANCIAL STATEMENTS (CONTINUED)
FOR THE YEAR TO 30 JUNE 2010
17