3M 2007 Annual Report Download - page 92
Download and view the complete annual report
Please find page 92 of the 2007 3M annual report below. You can navigate through the pages in the report by either clicking on the pages listed below, or by using the keyword search tool below to find specific information within the annual report.-
 1
1 -
2
-
3
-
4
-
5
-
6
-
7
-
8
-
9
-
10
-
11
-
12
-
13
-
14
-
15
-
16
-
17
-
18
-
19
-
20
-
21
-
22
-
23
-
24
-
25
-
26
-
27
-
28
-
29
-
30
-
31
-
32
-
33
-
34
-
35
-
36
-
37
-
38
-
39
-
40
-
41
-
42
-
43
-
44
-
45
-
46
-
47
-
48
-
49
-
50
-
51
-
52
-
53
-
54
-
55
-
56
-
57
-
58
-
59
-
60
-
61
-
62
-
63
-
64
-
65
-
66
-
67
-
68
-
69
-
70
-
71
-
72
-
73
-
74
-
75
-
76
-
77
-
78
-
79
-
80
-
81
-
 82
82 -
 83
83 -
 84
84 -
 85
85 -
 86
86 -
 87
87 -
 88
88 -
 89
89 -
 90
90 -
 91
91 -
 92
92 -
 93
93 -
 94
94 -
 95
95 -
 96
96 -
 97
97 -
 98
98 -
 99
99 -
 100
100
 |
 |

86
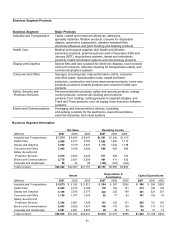
Segment assets for the operating business segments (excluding Corporate and Unallocated) primarily include accounts
receivable; inventory; property, plant and equipment – net; goodwill and intangible assets; and other miscellaneous
assets. Assets included in Corporate and Unallocated principally are cash, cash equivalents and marketable securities;
insurance receivables; deferred income taxes; certain investments and other assets, including prepaid pension assets;
and certain unallocated property, plant and equipment. Corporate and unallocated assets can change from year to year
due to changes in cash, cash equivalents and marketable securities, changes in prepaid pension and postretirement
benefits, and changes in other unallocated asset categories. For management reporting purposes, corporate goodwill
(which at December 31, 2007, totaled approximately $400 million) is not allocated to the six operating business segments.
In Note 3, corporate goodwill has been allocated to the respective market segments as required by SFAS No. 142 for
impairment testing.
Corporate and Unallocated operating income principally includes corporate investment gains and losses, certain
derivative gains and losses, insurance-related gains and losses, certain litigation expenses, corporate restructuring
program charges and other miscellaneous items. Because this category includes a variety of miscellaneous items, it is
subject to fluctuation on a quarterly and annual basis.
Refer to Note 2 and Note 4 for discussion of items that significantly impact business segment reported results. The most
significant items impacting both 2007 and 2006 results are the net gain on sale of the pharmaceuticals business (within
the Health Care segment) and restructuring and other actions.
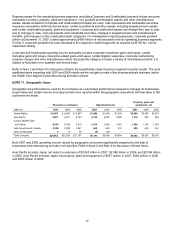
NOTE 17. Geographic Areas
Geographic area information is used by the Company as a secondary performance measure to manage its businesses.
Export sales and certain income and expense items are reported within the geographic area where the final sales to 3M
customers are made.
Net sales to customers
Operating Income
Property, plant and
equipment, net
(Millions)
2007 2006 2005
2007 2006 2005
2007 2006 2005
United States $ 8,987 $ 8,853 $ 8,267 $1,692 $1,908 $1,200
$3,668 $3,382 $3,291
Asia Pacific 6,601 6,251 5,744
2,136 2,097 2,085 1,116 959 865
Europe, Middle East
and Africa 6,503 5,726 5,219
1,705 1,092 1,057 1,308 1,162 1,076
Latin America and Canada 2,365 2,080 1,881 665 629 512 490 404 361
Other Unallocated 6 13 56
(5) (30) – – – –
Total Company $24,462 $22,923 $21,167 $6,193 $5,696 $4,854
$6,582 $5,907 $5,593
Both 2007 and 2006 operating income results by geographic area were significantly impacted by the sale of
businesses and restructuring and other exit activities. Refer to Note 2 and Note 4 for discussion of these items.
Asia Pacific includes Japan net sales to customers of $2.063 billion in 2007, $2.048 billion in 2006, and $2.094 billion
in 2005. Asia Pacific includes Japan net property, plant and equipment of $357 million in 2007, $345 million in 2006,
and $350 million in 2005.