3M 2007 Annual Report Download - page 26
Download and view the complete annual report
Please find page 26 of the 2007 3M annual report below. You can navigate through the pages in the report by either clicking on the pages listed below, or by using the keyword search tool below to find specific information within the annual report.-
 1
1 -
2
-
3
-
4
-
5
-
6
-
7
-
8
-
9
-
10
-
11
-
12
-
13
-
14
-
15
-
 16
16 -
 17
17 -
 18
18 -
 19
19 -
 20
20 -
 21
21 -
 22
22 -
 23
23 -
 24
24 -
 25
25 -
 26
26 -
 27
27 -
 28
28 -
 29
29 -
 30
30 -
 31
31 -
 32
32 -
 33
33 -
 34
34 -
 35
35 -
 36
36 -
37
-
38
-
39
-
40
-
41
-
42
-
43
-
44
-
45
-
46
-
47
-
48
-
49
-
50
-
51
-
52
-
53
-
54
-
55
-
56
-
57
-
58
-
59
-
60
-
61
-
62
-
63
-
64
-
65
-
66
-
67
-
68
-
69
-
70
-
71
-
72
-
73
-
74
-
75
-
76
-
77
-
78
-
79
-
80
-
81
-
82
-
83
-
84
-
85
-
86
-
87
-
88
-
89
-
90
-
91
-
92
-
93
-
94
-
95
-
96
-
97
-
98
-
99
-
100
 |
 |

20
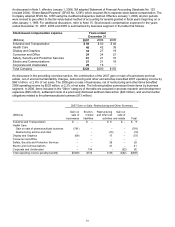
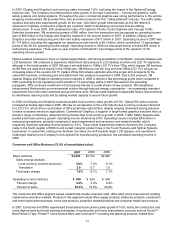
2006 Gain on Sale, Restructuring and Other Summary
Gain on sale
of pharma-
Pharma-
ceuticals
Over-
head
Busi-
ness
Total
restruc-
(Millions) ceuticals restructuring reduction specific turing
business actions actions actions actions Other Total
Industrial and Transportation $ – $ – $ –$ 15 $ 15 $ – $ 15
Health Care:
Gain on sale of pharmaceuticals business (1,074) – – – – – (1,074)
Restructuring actions and other – 166 11
2
15 293 108 401
Display and Graphics – – –39 39 – 39
Consumer and Office – – – – – – –
Safety, Security and Protection Services – – –10 10 – 10
Electro and Communications – – –46 46 – 46
Corporate and Unallocated – – – – – 40 40
Total operating income penalty (benefit) $(1,074) $166 $112 $125 $403 $148 $ (523)
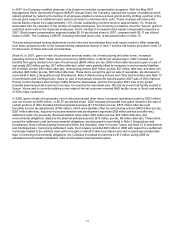
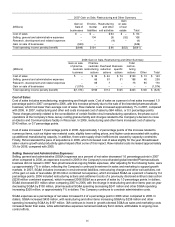
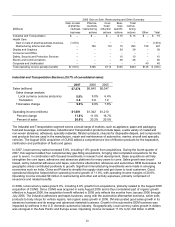
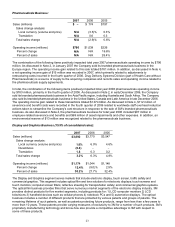
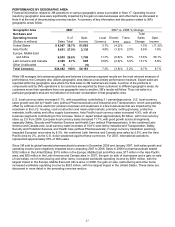
Industrial and Transportation Business (29.7% of consolidated sales):
2007 2006 2005
Sales (millions) $7,274 $6,640 $6,047
Sales change analysis:
Local currency (volume and price) 5.8% 9.0% 6.4%
Translation 3.8 0.8 1.2
Total sales change 9.6% 9.8% 7.6%
Operating income (millions) $1,501 $1,342 $1,210
Percent change 11.8% 11.0% 16.7%
Percent of sales 20.6% 20.2% 20.0%
The Industrial and Transportation segment serves a broad range of markets, such as appliance, paper and packaging,
food and beverage, and automotive. Industrial and Transportation products include tapes, a wide variety of coated and
non-woven abrasives, adhesives, specialty materials, filtration products, closures for disposable diapers, and components
and products that are used in the manufacture, repair and maintenance of automotive, marine, aircraft and specialty
vehicles. The August 2005 acquisition of CUNO added a comprehensive line of filtration products for the separation,
clarification and purification of fluids and gases.
In 2007, local-currency sales increased 5.8%, including 1.8% growth from acquisitions. During the fourth quarter of
2007, this segment added four complementary gap-filling acquisitions, bringing total completed acquisitions for the
year to seven. In combination with focused investments in research and development, these acquisitions will help
strengthen the core tapes, adhesives and abrasives platforms for many years to come. Sales growth was broad-
based, led by industrial adhesives and tapes, automotive aftermarket, abrasives and automotive OEM businesses. All
geographic areas contributed positively to growth. Significant manufacturing investments were made in emerging
economies such as India, China and Poland to simplify the supply chain and get closer to local customers. Good
operational discipline helped deliver operating income growth of 11.8%, with operating income margins of 20.6%.
Operating income included $9 million in restructuring and other exit activity expenses, primarily comprised of
severance and related benefits.
In 2006, local-currency sales grew 9.0%, including 4.6% growth from acquisitions, primarily related to the August 2005
acquisition of CUNO. Since CUNO was acquired in early August 2005 and is thus considered part of organic growth
effective in August 2006, the acquisition benefit reflected in 2006 only reflects the months from January 2006 through
July 2006. The industrial adhesives and tapes business, along with the automotive aftermarket business, which sells
products to body shops for vehicle repairs, led organic sales growth in 2006. 3M also posted good sales growth in its
abrasives business and its energy and advanced materials business. Growth in the automotive OEM business was
impacted by softness in the U.S. domestic automotive industry. Geographically, local-currency sales growth in dollars
was strongest in the Asia Pacific and Europe areas. Operating income increased 11.0% to $1.342 billion in 2006.