eTrade 2002 Annual Report Download - page 16
Download and view the complete annual report
Please find page 16 of the 2002 eTrade annual report below. You can navigate through the pages in the report by either clicking on the pages listed below, or by using the keyword search tool below to find specific information within the annual report.-
 1
1 -
2
-
3
-
4
-
5
-
 6
6 -
 7
7 -
 8
8 -
 9
9 -
 10
10 -
 11
11 -
 12
12 -
 13
13 -
 14
14 -
 15
15 -
 16
16 -
 17
17 -
 18
18 -
 19
19 -
 20
20 -
 21
21 -
 22
22 -
 23
23 -
 24
24 -
 25
25 -
 26
26 -
27
-
28
-
29
-
30
-
31
-
32
-
33
-
34
-
35
-
36
-
37
-
38
-
39
-
40
-
41
-
42
-
43
-
44
-
45
-
46
-
47
-
48
-
49
-
50
-
51
-
52
-
53
-
54
-
55
-
56
-
57
-
58
-
59
-
60
-
61
-
62
-
63
-
64
-
65
-
66
-
67
-
68
-
69
-
70
-
71
-
72
-
73
-
74
-
75
-
76
-
77
-
78
-
79
-
80
-
81
-
82
-
83
-
84
-
85
-
86
-
87
-
88
-
89
-
90
-
91
-
92
-
93
-
94
-
95
-
96
-
97
-
98
-
99
-
100
-
101
-
102
-
103
-
104
-
105
-
106
-
107
-
108
-
109
-
110
-
111
-
112
-
113
-
114
-
115
-
116
-
117
-
118
-
119
-
120
-
121
-
122
-
123
-
124
-
125
-
126
-
127
-
128
-
129
-
130
-
131
-
132
-
133
-
134
-
135
-
136
-
137
-
138
-
139
-
140
-
141
-
142
-
143
-
144
-
145
-
146
-
147
-
148
-
149
-
150
-
151
-
152
-
153
-
154
-
155
-
156
-
157
-
158
-
159
-
160
-
161
-
162
-
163
-
164
-
165
-
166
-
167
-
168
-
169
-
170
-
171
-
172
-
173
-
174
-
175
-
176
-
177
-
178
-
179
-
180
-
181
-
182
-
183
-
184
-
185
-
186
-
187
-
188
-
189
-
190
-
191
-
192
-
193
-
194
-
195
-
196
-
197
-
198
-
199
-
200
-
201
-
202
-
203
-
204
-
205
-
206
-
207
-
208
-
209
-
210
-
211
-
212
-
213
-
214
-
215
-
216
 |
 |

Table of Contents
Index to Financial Statements
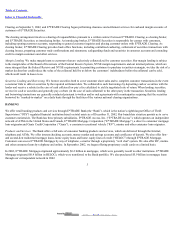
Delinquent, Non-performing and Other Problem Assets
General. We continually monitor our loan portfolio so that we will be able to anticipate and address potential and actual delinquencies. Based
on the length of the delinquency period, we reclassify these assets as non-performing and, if necessary, take possession of the underlying
collateral. Once the Bank takes possession of the underlying collateral, the property is classified on our balance sheet as other assets.
Non-performing Assets .Loans for which payment of principal or interest is 90 days past due, as well as other loans considered uncollectible,
are placed on non-accrual status. All non-accrual loans are considered non-performing. Interest income is not accrued for loans classified as
non-performing and any income accrued through the initial 90-day delinquency is reversed. Accretion of deferred loan fees is discontinued for
non-accrual loans. The Company’ s method of accounting for payments received on non-accrual loans is to recognize payments as interest
income when the loan is considered collectible and to apply payments to principal when it is doubtful that principal and interest will be fully
recovered.
Real Estate Owned and Repossessed Assets. At acquisition, we record Real Estate Owned (“REO”) and repossessed assets at estimated fair
value less estimated selling costs. Fair value is determined by appraisal or other appropriate valuation method. Losses estimated at the time of
acquisition are charged to the allowance for loan losses. Management performs periodic valuations and establishes a valuation allowance for
REO and repossessed assets through a charge to income if the carrying value of a property exceeds its estimated fair value less estimated selling
costs.
As of December 31, 2002, our REO and repossessed assets consisted of $1.6 million of one to four-family real estate loans, $1.4 million of
automobile loans and $3.7 million of RV loans.
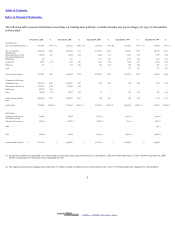
The following table presents information about our non-accrual loans and other repossessed assets at the dates indicated (in thousands):
December31, 2002 December31, 2001 September30, 2000 September30, 1999 September30, 1998
Real estate loans:
One- to four-family $ 22,497 $ 20,595 $ 11,391 $ 7,595 $ 7,727
Home equity lines of credit and second
mortgage loans
81 — — 21 255
Commercial — — 657 664 372
Land — — — — 316
Automobiles loans 2,277 91 — — —
Marine loans 94 — — — —
Recreational vehicles loans 1,486 — — — —
Other 53 — — 60 205
Total non-performing loans, net 26,488 20,686 12,048 8,340 8,875
Total REO and other repossessed assets, net 6,723 3,328 850 539 1,460
Total non-performing assets, net $ 33,211 $ 24,014 $ 12,898 $ 8,879 $ 10,335
Total non-performing assets, net, as a
percentage of total bank assets
0.19 %
0.18 %
0.14 %
0.21 %
0.45 %
Total loss allowance as a percentage of total
non-performing loans, net
104.45 %
96.07 %
90.72 %
85.86 %
53.70 %
During fiscal 2002, our non-performing assets increased by $9.2 million, or 38%, to $33.2 million at December 31, 2002 from $24.0 million at
December 31, 2001. This increase was attributable primarily to the
8
2003. EDGAR Online, Inc.