eTrade 2002 Annual Report Download - page 11
Download and view the complete annual report
Please find page 11 of the 2002 eTrade annual report below. You can navigate through the pages in the report by either clicking on the pages listed below, or by using the keyword search tool below to find specific information within the annual report.-
 1
1 -
 2
2 -
 3
3 -
 4
4 -
 5
5 -
 6
6 -
 7
7 -
 8
8 -
 9
9 -
 10
10 -
 11
11 -
 12
12 -
 13
13 -
 14
14 -
 15
15 -
 16
16 -
 17
17 -
 18
18 -
 19
19 -
 20
20 -
 21
21 -
 22
22 -
23
-
24
-
25
-
26
-
27
-
28
-
29
-
30
-
31
-
32
-
33
-
34
-
35
-
36
-
37
-
38
-
39
-
40
-
41
-
42
-
43
-
44
-
45
-
46
-
47
-
48
-
49
-
50
-
51
-
52
-
53
-
54
-
55
-
56
-
57
-
58
-
59
-
60
-
61
-
62
-
63
-
64
-
65
-
66
-
67
-
68
-
69
-
70
-
71
-
72
-
73
-
74
-
75
-
76
-
77
-
78
-
79
-
80
-
81
-
82
-
83
-
84
-
85
-
86
-
87
-
88
-
89
-
90
-
91
-
92
-
93
-
94
-
95
-
96
-
97
-
98
-
99
-
100
-
101
-
102
-
103
-
104
-
105
-
106
-
107
-
108
-
109
-
110
-
111
-
112
-
113
-
114
-
115
-
116
-
117
-
118
-
119
-
120
-
121
-
122
-
123
-
124
-
125
-
126
-
127
-
128
-
129
-
130
-
131
-
132
-
133
-
134
-
135
-
136
-
137
-
138
-
139
-
140
-
141
-
142
-
143
-
144
-
145
-
146
-
147
-
148
-
149
-
150
-
151
-
152
-
153
-
154
-
155
-
156
-
157
-
158
-
159
-
160
-
161
-
162
-
163
-
164
-
165
-
166
-
167
-
168
-
169
-
170
-
171
-
172
-
173
-
174
-
175
-
176
-
177
-
178
-
179
-
180
-
181
-
182
-
183
-
184
-
185
-
186
-
187
-
188
-
189
-
190
-
191
-
192
-
193
-
194
-
195
-
196
-
197
-
198
-
199
-
200
-
201
-
202
-
203
-
204
-
205
-
206
-
207
-
208
-
209
-
210
-
211
-
212
-
213
-
214
-
215
-
216
 |
 |

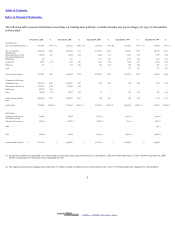
Table of Contents
Index to Financial Statements
The following table presents information concerning our banking loan portfolio, in dollar amounts and in percentages, by type of loan (dollars
in thousands):
December31, 2002 % December31, 2001 % September30, 2000 % September30, 1999 % September30, 1998 %
Real estate loans:
One- to four-family fixed-rate $ 1,877,265 26.05 %
$ 3,672,512 45.95 %
$ 1,583,129 37.45 %
$ 1,391,254 63.69 %
$ 466,850 50.76 %
One- to four-family
adjustable-rate
1,502,224 20.86 2,645,952 33.11 2,635,955 62.36 785,821 35.98 430,319 46.79
Home equity lines of credit
and second mortgage loans
354,768 4.93 23,059 0.29 4,042 0.10 1,024 0.05 5,895 0.64
Multi-family 106 — 183 — 203 0.01 1,330 0.06 3,223 0.35
Commercial 13,397 0.19 1,981 0.03 2,717 0.06 3,050 0.14 8,916 0.97
Mixed-use 121 — 635 0.01 503 0.01 945 0.04 929 0.10
Land — — — — — — 279 0.01 316 0.03
Total real estate loans(1) 3,747,881 52.03 6,344,322 79.39 4,226,549 99.99 2,183,703 99.97 916,448 99.64
Consumer and other loans:
Automobiles loans 1,481,695 20.57 1,436,407 17.97 224 0.01 430 0.02 2,758 0.30
Recreational vehicles loans 1,366,876 18.98 198,643 2.49 — — — — — —
Marine loans 453,783 6.30 — — — — — — — —
Other 152,645 2.12 12,237 0.15 82 — 255 0.01 554 0.06
Total consumer and other
loans
3,454,999 47.97 1,647,287 20.61 306 0.01 685 0.03 3,312 0.36
Total loans(1) 7,202,880 100.00 %
7,991,609 100.00 %
4,226,855 100.00 %
2,184,388 100.00 %
919,760 100.00 %
Add (deduct):
Premiums (discounts) and
deferred fees on loans
190,506 38,722 (43,171 )
(22,718 )
(9,989 )
Allowance for loan losses (27,666 )
(19,874 )
(10,930 )
(7,161 )
(4,766 )
Other — — — — (151 )
Total 162,840 18,848 (54,101 )
(29,879 )
(14,906 )
Loansreceivable, net(1)(2) $ 7,365,720 $ 8,010,457 $ 4,172,754 $ 2,154,509 $ 904,854
(1) Includes loans held-for-sale, principally one- to four-family real estate loans. These loans were $1,812,739 at December31, 2002, $1,616,089 at December 31, 2001, $95,400 at September 30, 2000,
$89,862 at September 30, 1999 and $117,928 at September30, 1998.
(2) The largest concentrations of mortgage loans at December 31, 2002 are located in California (32.4% of the portfolio), New York (7.9% of the portfolio) and Virginia (6.2% of the portfolio).
5
2003. EDGAR Online, Inc.