Whirlpool 2001 Annual Report Download - page 32
Download and view the complete annual report
Please find page 32 of the 2001 Whirlpool annual report below. You can navigate through the pages in the report by either clicking on the pages listed below, or by using the keyword search tool below to find specific information within the annual report.-
 1
1 -
2
-
3
-
4
-
5
-
6
-
7
-
8
-
9
-
10
-
11
-
12
-
13
-
14
-
15
-
16
-
17
-
18
-
19
-
20
-
21
-
 22
22 -
 23
23 -
 24
24 -
 25
25 -
 26
26 -
 27
27 -
 28
28 -
 29
29 -
 30
30 -
 31
31 -
 32
32 -
 33
33 -
 34
34 -
 35
35 -
 36
36 -
 37
37 -
 38
38 -
 39
39 -
 40
40 -
 41
41 -
 42
42 -
43
-
44
-
45
-
46
-
47
-
48
-
49
-
50
-
51
-
52
-
53
-
54
-
55
-
56
-
57
-
58
-
59
-
60
-
61
-
62
-
63
-
64
-
65
-
66
-
67
-
68
 |
 |

Management’s Discussion and Analysis30
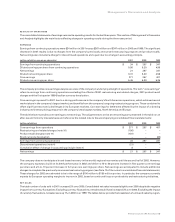
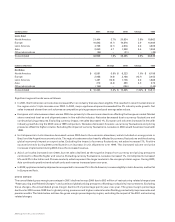
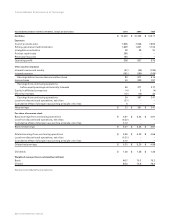
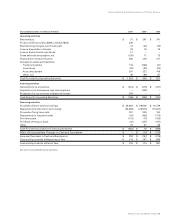
(in thousands) 2001 Change 2000 Change 1999
Units Sold
North America 21,404 3.7% 20,634 3.9% 19,862
Europe 10,803 (0.7) 10,876 3.9 10,469
Latin America 4,738 (3.7) 4,918 2.3 4,809
Asia 2,050 4.7 1,958 5.4 1,858
Other/eliminations (36) –(31) –(49)
Consolidated 38,959 1.6% 38,355 3.8% 36,949
(millions of dollars) 2001 Change 2000 Change 1999
Net Sales
North America $ 6,581 5.8% $ 6,223 1.0% $ 6,159
Europe 2,058 (4.5) 2,156 (12.1) 2,452
Latin America 1,487 (12.8) 1,706 2.3 1,668
Asia 373 (4.4) 390 4.0 375
Other/eliminations (156) –(150) –(143)
Consolidated $ 10,343 0.2% $ 10,325 (1.8)% $ 10,511
Significant regional trends were as follows:
In 2001, North American unit volumes increased 4% in an industry that was down slightly. This resulted in record market share in
the region and a 1.4 pts increase over 2000. In 2000, major appliance shipments exceeded the 2% industry-wide growth. Net
sales increased slower than unit volumes as competitive pricing pressures reduced average sales values.
European unit volumes were down versus 2000 due primarily to the economic downturn affecting the European market. Market
share remained level as unit shipments were in line with the industry. Net sales decreased due to currency fluctuations and
continued pricing pressures. Excluding currency impact, net sales decreased 1%. European unit volumes increased in line with
industry growth during the 2000 versus 1999 comparison. Net sales decreased, however, as currency fluctuations and pricing
pressures offset the higher volume. Excluding the impact of currency fluctuations, net sales in 2000 would have been level with
1999.
Unit shipments in Latin America decreased versus 2000 due to the economic slowdown, which included an energy crisis in
Brazil and the Argentine economic crisis. The region’s sales were also heavily affected by currency fluctuations and the slowing
global economy’s impact on export sales. Excluding the impact of currency fluctuations, net sales increased 1%. Positive
economic trends during 2000 contributed to an increase in unit shipments over 1999. The increased volume and price
increases implemented during 2000 drove the increased revenue.
Asia’s unit sales increased over 2000, but net sales declined as the negative impact from currency and pricing pressures
combined to offset the higher unit volume. Excluding currency fluctuations, net sales increased 1%. Unit shipments increased
5% and 43% in the Indian and Chinese markets, which represent the larger markets in the company’s Asian region. During 2000,
Asia continued a positive trend as both units and revenue increased year-over-year.
In 2002, appliance industry shipments are expected to increase 2% in North America, increase slightly in Latin America, and be flat
in Europe and Asia.
GROSS MARGIN
The consolidated gross margin percentage in 2001 declined versus 2000 due to $53 million of restructuring related charges (see
“Restructuring and Related Charges”) and continued global pricing pressures offsetting productivity improvements. Excluding
these charges, the consolidated gross margin declined 0.2 percentage points year-over-year. The gross margin percentage
declined in 2000 versus 1999 due to global pricing pressures and higher material costs offsetting productivity improvements and
pension credits. The table below outlines the gross margin percentages by region, excluding the impact of the 2001 restructuring
related charges.