United Technologies 2012 Annual Report Download - page 21
Download and view the complete annual report
Please find page 21 of the 2012 United Technologies annual report below. You can navigate through the pages in the report by either clicking on the pages listed below, or by using the keyword search tool below to find specific information within the annual report.-
 1
1 -
2
-
3
-
4
-
5
-
6
-
7
-
8
-
9
-
10
-
 11
11 -
 12
12 -
 13
13 -
 14
14 -
 15
15 -
 16
16 -
 17
17 -
 18
18 -
 19
19 -
 20
20 -
 21
21 -
 22
22 -
 23
23 -
 24
24 -
 25
25 -
 26
26 -
 27
27 -
 28
28 -
 29
29 -
 30
30 -
 31
31 -
32
-
33
-
34
-
35
-
36
-
37
-
38
-
39
-
40
-
41
-
42
-
43
-
44
-
45
-
46
-
47
-
48
-
49
-
50
-
51
-
52
-
53
-
54
-
55
-
56
-
57
-
58
-
59
-
60
-
61
-
62
-
63
-
64
-
65
-
66
-
67
-
68
-
69
-
70
-
71
-
72
-
73
-
74
-
75
-
76
-
77
-
78
-
79
-
80
-
81
-
82
-
83
-
84
-
85
-
86
-
87
-
88
-
89
-
90
-
91
-
92
-
93
-
94
-
95
-
96
-
97
-
98
-
99
-
100
-
101
-
102
-
103
-
104
 |
 |

| 19
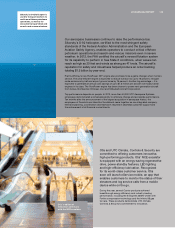
2012 ANNUAL REPORT
09 11 1510 12
09 11 1510 12
09 11 1510 12
09 11 1510 12
09 11 1510 12
1110 12
09 11 1510 12
09 11 1510 12
Non-Greenhouse
Gas Emissions
Million lbs
Greenhouse Gas Emissions
Million metric tons CO2e
Industrial Process Waste
Million lbs
Worldwide Water
Consumption
Billion gals
Lost Workday
Incident Rate
Cases/100 employees
Total Recordable
Incident Rate
Cases/100 employees
Supplier EH&S
Percent critical suppliers
meeting expectations
Corporate
Responsibility
Key Performance Indicators measure UTC’s sustainability goals and performance for current and
discontinued operations. UTC reporting standards include the ongoing analysis and correction
of data, as applicable, following the close of a reporting period. Consequently, previously reported
annual metric results may change between annual reporting periods, and UTC may include any prior
year data revisions in current reporting. Additional information detailing our progress is available at
www.utc.com/responsibility.
Non-Recycled Industrial
Process Waste
Million lbs
1.31 1.95
1.65
100 100
255
0.18
1.19 1.89
1.62
242
0.14
1.24 1.85
1.56
93
247
0.20
0.92
1.75
1.40
223
0.19
0.92
1.82
1.23
61.0
0.75
55.0
0.64
51.4
0.74
47.8
0.73
43.3
0.68
203
0.15
903
834613