United Healthcare 2004 Annual Report Download - page 63
Download and view the complete annual report
Please find page 63 of the 2004 United Healthcare annual report below. You can navigate through the pages in the report by either clicking on the pages listed below, or by using the keyword search tool below to find specific information within the annual report.-
 1
1 -
2
-
3
-
4
-
5
-
6
-
7
-
8
-
9
-
10
-
11
-
12
-
13
-
14
-
15
-
16
-
17
-
18
-
19
-
20
-
21
-
22
-
23
-
24
-
25
-
26
-
27
-
28
-
29
-
30
-
31
-
32
-
33
-
34
-
35
-
36
-
37
-
38
-
39
-
40
-
41
-
42
-
43
-
44
-
45
-
46
-
47
-
48
-
49
-
50
-
51
-
52
-
 53
53 -
 54
54 -
 55
55 -
 56
56 -
 57
57 -
 58
58 -
 59
59 -
 60
60 -
 61
61 -
 62
62 -
 63
63 -
 64
64 -
 65
65 -
 66
66 -
 67
67 -
 68
68 -
 69
69 -
 70
70 -
 71
71 -
 72
72
 |
 |

UNITEDHEALTH GROUP 61
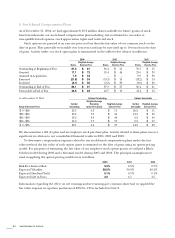
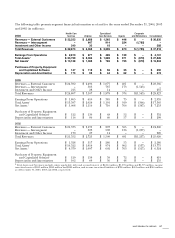
The following table presents segment financial information as of and for the years ended December 31, 2004, 2003
and 2002 (in millions):
Health Care Specialized Corporate
2004
Services Uniprise Care Services Ingenix and Eliminations Consolidated
Revenues — External Customers $ 32,333 $ 2,688 $ 1,363 $ 446 $ – $ 36,830
Revenues — Intersegment – 647 914 224 (1,785) –
Investment and Other Income 340 30 18 – – 388
Total Revenues $ 32,673 $ 3,365 $ 2,295 $ 670 $ (1,785) $ 37,218
Earnings From Operations $ 2,810 $ 677 $ 485 $ 129 $ – $ 4,101
Total Assets 1$23,799 $ 2,366 $ 1,269 $ 971 $ (879) $ 27,526
Net Assets 1$13,138 $ 1,385 $ 765 $ 795 $ (879) $ 15,204
Purchases of Property, Equipment
and Capitalized Software $ 147 $ 112 $ 56 $ 35 $ – $ 350
Depreciation and Amortization $ 173 $ 95 $ 44 $ 62 $ – $ 374
2003
Revenues — External Customers $24,592 $2,496 $1,077 $401 $–$28,566
Revenues — Intersegment – 583 787 173 (1,543) –
Investment and Other Income 215 28 14 – – 257
Total Revenues $24,807 $3,107 $1,878 $574 $(1,543) $28,823
Earnings From Operations $1,865 $610 $385 $75 $– $2,935
Total Assets
1
$13,597 $2,024 $1,191 $919 $(366) $17,365
Net Assets
1
$5,008 $1,116 $710 $766 $(347) $7,253
Purchases of Property, Equipment
and Capitalized Software $122 $130 $48 $52 $–$352
Depreciation and Amortization $116 $86 $40 $57 $–$299
2002
Revenues — External Customers $21,373 $2,175 $897 $355 $–$24,800
Revenues — Intersegment – 523 598 136 (1,257) –
Investment and Other Income 179 27 14 – – 220
Total Revenues $21,552 $2,725 $1,509 $491 $(1,257) $25,020
Earnings From Operations $1,328 $517 $286 $55 $–$2,186
Total Assets
1
$10,522 $1,914 $974 $902 $(537) $13,775
Net Assets
1
$4,379 $1,097 $602 $763 $(517) $6,324
Purchases of Property, Equipment
and Capitalized Software $129 $159 $59 $72 $–$419
Depreciation and Amortization $102 $69 $36 $48 $–$255
1Total Assets and Net Assets exclude, where applicable, debt and accrued interest of $4,054 million, $1,993 million and $1,775 million, income
tax-related assets of $353 million, $269 million and $389 million, and income tax-related liabilities of $786 million, $401 million and $510 million
as of December 31, 2004, 2003 and 2002, respectively.