United Healthcare 2004 Annual Report Download - page 57
Download and view the complete annual report
Please find page 57 of the 2004 United Healthcare annual report below. You can navigate through the pages in the report by either clicking on the pages listed below, or by using the keyword search tool below to find specific information within the annual report.-
 1
1 -
2
-
3
-
4
-
5
-
6
-
7
-
8
-
9
-
10
-
11
-
12
-
13
-
14
-
15
-
16
-
17
-
18
-
19
-
20
-
21
-
22
-
23
-
24
-
25
-
26
-
27
-
28
-
29
-
30
-
31
-
32
-
33
-
34
-
35
-
36
-
37
-
38
-
39
-
40
-
41
-
42
-
43
-
44
-
45
-
46
-
 47
47 -
 48
48 -
 49
49 -
 50
50 -
 51
51 -
 52
52 -
 53
53 -
 54
54 -
 55
55 -
 56
56 -
 57
57 -
 58
58 -
 59
59 -
 60
60 -
 61
61 -
 62
62 -
 63
63 -
 64
64 -
 65
65 -
 66
66 -
 67
67 -
68
-
69
-
70
-
71
-
72
 |
 |

UNITEDHEALTH GROUP 55
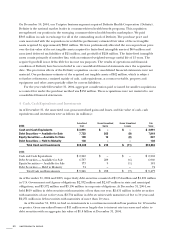
10 Income Taxes
The components of the provision for income taxes are as follows:
Year Ended December 31, (in millions) 2004 2003 2002
Current Provision
Federal
$1,223
$932 $675
State and Local
78
46 57
Total Current Provision
1,301
978 732
Deferred Provision
85
37 12
Total Provision for Income Taxes
$1,386
$1,015 $744
The reconciliation of the tax provision at the U.S. Federal Statutory Rate to the provision for income taxes
is as follows:
Year Ended December 31, (in millions) 2004 2003 2002
Tax Provision at the U.S. Federal Statutory Rate
$1,391
$994 $734
State Income Taxes, net of federal benefit
54
29 33
Tax-Exempt Investment Income
(33)
(30) (26)
Other, net
(26)
22 3
Provision for Income Taxes
$1,386
$1,015 $744
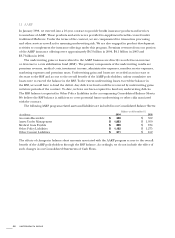
The components of deferred income tax assets and liabilities are as follows:
As of December 31, (in millions) 2004 2003
Deferred Income Tax Assets
Accrued Expenses and Allowances
$227
$161
Unearned Premiums
57
28
Medical Costs Payable and Other Policy Liabilities
85
83
Long-Term Liabilities
78
49
Net Operating Loss Carryforwards
123
86
Other
31
42
Subtotal
601
449
Less: Valuation Allowances
(28)
(43)
Total Deferred Income Tax Assets
573
406
Deferred Income Tax Liabilities
Capitalized Software Development
(223)
(186)
Net Unrealized Gains on Investments
(72)
(82)
Intangible Assets
(406)
(50)
Property and Equipment
(63)
(58)
Other
(16)
–
Total Deferred Income Tax Liabilities
(780)
(376)
Net Deferred Income Tax Assets (Liabilities)
$(207)
$30
Valuation allowances are provided when it is considered more likely than not that deferred tax assets will
not be realized. The valuation allowances primarily relate to future tax benefits on certain federal and
state net operating loss carryforwards. Federal net operating loss carryforwards expire beginning in 2017
through 2023, and state net operating loss carryforwards expire beginning in 2005 through 2024.
We made cash payments for income taxes of $898 million in 2004, $783 million in 2003 and $458 million
in 2002. We increased additional paid-in capital and reduced income taxes payable by $358 million in
2004, $222 million in 2003, and by $133 million in 2002 to reflect the tax benefit we received upon the
exercise of non-qualified stock options.
Internal Revenue Service examinations for fiscal years 2000 through 2002 have been completed
and the resulting settlements have been included in our 2004 consolidated operating results.