TomTom 2006 Annual Report Download - page 38
Download and view the complete annual report
Please find page 38 of the 2006 TomTom annual report below. You can navigate through the pages in the report by either clicking on the pages listed below, or by using the keyword search tool below to find specific information within the annual report.-
 1
1 -
2
-
3
-
4
-
5
-
6
-
7
-
8
-
9
-
10
-
11
-
12
-
13
-
14
-
15
-
16
-
17
-
18
-
19
-
20
-
21
-
22
-
23
-
24
-
25
-
26
-
27
-
 28
28 -
 29
29 -
 30
30 -
 31
31 -
 32
32 -
 33
33 -
 34
34 -
 35
35 -
 36
36 -
 37
37 -
 38
38 -
 39
39 -
 40
40 -
 41
41 -
 42
42 -
 43
43 -
 44
44 -
 45
45 -
 46
46 -
 47
47 -
 48
48 -
49
-
50
-
51
-
52
-
53
-
54
-
55
-
56
-
57
-
58
-
59
-
60
-
61
-
62
-
63
-
64
-
65
-
66
-
67
-
68
-
69
-
70
-
71
-
72
-
73
 |
 |

36 TomTom Annual Report 2006
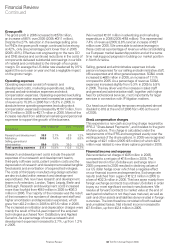
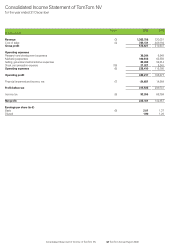
Gross profit
The gross profit in 2006 increased to 579 million,
an increase of 86% over 2005 (2005: 311 million).
Despite the 27% reduction in the average selling price
for PNDs the gross profit margin continued to be strong
at 42%, only one percentage point lower than in 2005
(2005: 43%). Effective cost engineering on the new GO
and ONE devices and continued reductions in the costs of
components delivered substantial cost savings in our bills
of material and contributed to the strength of our gross
margin. On average the US dollar rate weakened by 0.5%
against the euro year on year and had a negligible impact
on the gross margin.
Operating expenses
Operating expenses consist of research and
development costs, marketing expenditures, selling,
general and administrative expenses and stock
compensation expenses. Operating expenses (excluding
stock compensation expenses) increased as a percentage
of revenue to 15.9% in 2006 from 15.3% in 2005. In
absolute terms operating expenses (excluding stock
compensation expenses) increased by 107 million, from
110 million in 2005 to 217 million in 2006. Most of the
increase resulted from additional marketing and personnel
expenses to support the growth of the business.
2006 % revenue 2005 % revenue
(in millions)
Research and development 36.3 2.7% 8.9 1.2%
Marketing 100.8 7.4% 63.6 8.8%
Selling, general and
administrative 80.0 5.9% 38.0 5.3%
Total operating expenses 217.1 15.9% 110.5 15.3%
Research and development costs include the payroll
expenses of our research and development teams,
third-party software costs, patent creation costs and the
depreciation of research and development-related tangible
fixed assets and amortisation of acquired technologies.
The costs of third-party manufacturing design activities
are also included within research and development
expenditures. We now have research and development
teams in Amsterdam, London, Taipei, Leipzig, Berlin and
Edinburgh. Research and development costs increased
more than fourfold from 8.9 million in 2005 to 36.3
million in 2006. The majority of the increase was the result
of the increase in the numbers of development staff and
higher amortisation and depreciation expenses, which
grew from 2.2 million in 2005 to 15.5 million in 2006.
The increased amortisation and depreciation charges were
mainly the result of the full-year impact of the acquired
technologies purchased from Datafactory and Applied
Generics. As a percentage of revenue research and
development expenses increased to 2.7%, up from 1.2%
in 2005.
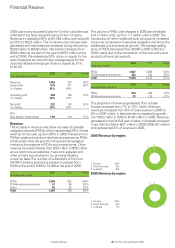
We invested 101 million in advertising and marketing
expenditure in 2006 (2005: 64 million). This represented
7.4% of revenue (2005: 8.8%) and an increase of 37
million over 2005. We were able to achieve leverage in
these costs as a percentage of revenue while consolidating
our European market leadership position and at the same
time making good progress in building our market position
in North America.
Selling, general and administrative expenses include
personnel expenses for our selling and administrative staff,
office expenses and other general expenses. SG&A costs
increased to 80 million in 2006, an increase of 111%
compared to 2005. As a percentage of revenue SG&A
expenses increased slightly from 5.3% in 2005 to 5.9%
in 2006. The key driver was the increase in sales staff
and general and administrative staff, together with higher
fees for professional services, most importantly for legal
services in connection with IP litigation matters.
Our head count (excluding temporary employees) almost
doubled to 818 at the end of 2006 from 435 at the end
of 2005.
Stock compensation charges
This expense is a non-cash accounting charge required by
IFRS 2 “Share-based Payments”, and it relates to the grant
of share options. This charge is calculated under the
requirements of the IFRS and recognised evenly over the
vesting period of the share options. In 2006 we recognised
a charge of 21 million (2005: 5 million) of which 2.5
million was related to new share options granted in 2006.
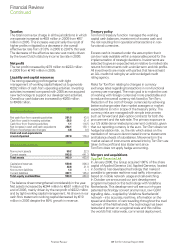
Financial income and expenses
We recorded a net charge of 25 million in 2006,
compared to a net gain of 15 million in 2005. The
reversed trend in the US dollar-euro exchange rate in
2006 compared to 2005 resulted in declining values of
our US dollar hedge cover which had a negative effect
on our financial income and expense line. Exchange rate
results switched from a gain of 12.3 million in 2005 to
a loss of 32.3 million in 2006. This loss arose mainly from
foreign exchange contracts to purchase US dollars in order
to pay our most significant contract manufacturers. We
revalue all forward contracts to market value at the end of
each period whether or not they have matured, as well as
cash and other assets and liabilities denominated in foreign
currencies. The loss therefore consisted of both realised
and unrealised losses. Net interest income increased to
7.6 million, up from 2.4 million in 2005.
Financial Review
Financial Review
Continued