TomTom 2006 Annual Report Download - page 3
Download and view the complete annual report
Please find page 3 of the 2006 TomTom annual report below. You can navigate through the pages in the report by either clicking on the pages listed below, or by using the keyword search tool below to find specific information within the annual report.-
 1
1 -
 2
2 -
 3
3 -
 4
4 -
 5
5 -
 6
6 -
 7
7 -
 8
8 -
 9
9 -
 10
10 -
 11
11 -
 12
12 -
 13
13 -
 14
14 -
15
-
16
-
17
-
18
-
19
-
20
-
21
-
22
-
23
-
24
-
25
-
26
-
27
-
28
-
29
-
30
-
31
-
32
-
33
-
34
-
35
-
36
-
37
-
38
-
39
-
40
-
41
-
42
-
43
-
44
-
45
-
46
-
47
-
48
-
49
-
50
-
51
-
52
-
53
-
54
-
55
-
56
-
57
-
58
-
59
-
60
-
61
-
62
-
63
-
64
-
65
-
66
-
67
-
68
-
69
-
70
-
71
-
72
-
73
 |
 |

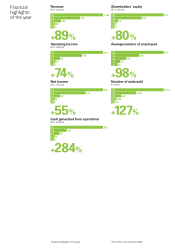
1TomTom Annual Report 2006Financial highlights of the year
Financial
highlights
of the year 06 1,364
720
192
39
8
05
04
03
02
Revenue
(in millions)
+89%
06 222
143
28
6
1
05
04
03
02
Net income
(in millions)
+55%
06 340
195
43
10
2
05
04
03
02
Operating income
(in millions)
+74 %
06 392
102
44
9
1
05
04
03
02
Cash generated from operations
(in millions)
+284%
06 551
306
38
8
2
05
04
03
02
Shareholders’ equity
(in millions)
+80%
06 627
316
150
75
38
05
04
03
02
Average number of employees
+98%
06 5,030
2,212
687
205
29
05
04
03
02
Number of units sold
(in 000s)
+127%