Tesco 2010 Annual Report Download - page 93
Download and view the complete annual report
Please find page 93 of the 2010 Tesco annual report below. You can navigate through the pages in the report by either clicking on the pages listed below, or by using the keyword search tool below to find specific information within the annual report.-
 1
1 -
2
-
3
-
4
-
5
-
6
-
7
-
8
-
9
-
10
-
11
-
12
-
13
-
14
-
15
-
16
-
17
-
18
-
19
-
20
-
21
-
22
-
23
-
24
-
25
-
26
-
27
-
28
-
29
-
30
-
31
-
32
-
33
-
34
-
35
-
36
-
37
-
38
-
39
-
40
-
41
-
42
-
43
-
44
-
45
-
46
-
47
-
48
-
49
-
50
-
51
-
52
-
53
-
54
-
55
-
56
-
57
-
58
-
59
-
60
-
61
-
62
-
63
-
64
-
65
-
66
-
67
-
68
-
69
-
70
-
71
-
72
-
73
-
74
-
75
-
76
-
77
-
78
-
79
-
80
-
81
-
82
-
 83
83 -
 84
84 -
 85
85 -
 86
86 -
 87
87 -
 88
88 -
 89
89 -
 90
90 -
 91
91 -
 92
92 -
 93
93 -
 94
94 -
 95
95 -
 96
96 -
 97
97 -
 98
98 -
 99
99 -
 100
100 -
 101
101 -
 102
102 -
 103
103 -
104
-
105
-
106
-
107
-
108
-
109
-
110
-
111
-
112
-
113
-
114
-
115
-
116
-
117
-
118
-
119
-
120
-
121
-
122
-
123
-
124
-
125
-
126
-
127
-
128
-
129
-
130
-
131
-
132
-
133
-
134
-
135
-
136
 |
 |

Financial statements
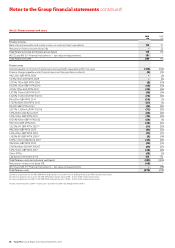
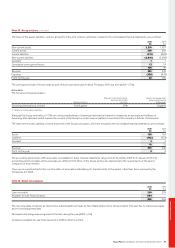
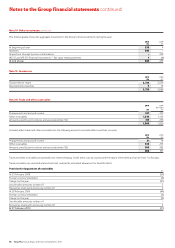
Note 10 Goodwill and other intangible assets continued
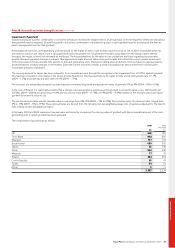
Impairment of goodwill
Goodwill arising on business combinations is not amortised but is reviewed for impairment on an annual basis or more frequently if there are indications
that goodwill may be impaired. Goodwill acquired in a business combination is allocated to groups of cash-generating units according to the level at
which management monitor that goodwill.
Recoverable amounts for cash-generating units are based on the higher of value in use and fair value less costs to sell. In 2010, recoverable amounts
are based on value in use. Value in use is calculated from cash flow projections for generally five years using data from the Group’s latest internal
forecasts, the results of which are reviewed by the Board. The key assumptions for the value in use calculations are those regarding discount rates,
growth rates and expected changes in margins. Management estimate discount rates using pre-tax rates that reflect the current market assessment
of the time value of money and the risks specific to the cash-generating units. Changes in selling prices and direct costs are based on past experience
and expectations of future changes in the market. Given the current economic climate, a sensitivity analysis has been performed in assessing the
recoverable amounts of goodwill.
The carrying amount for Japan has been reduced to its recoverable amount through the recognition of an impairment loss of £131m against goodwill.
This has been included in cost of sales in the Group Income Statement. The key assumptions for Japan include a long-term growth rate of 1.1%
(2009 – 1.5%) and a pre-tax discount rate of 6.1% (2009 – 7.3%).
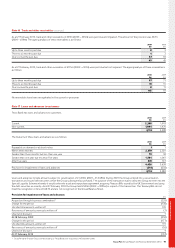
The forecasts are extrapolated beyond five years based on estimated long-term average growth rates of generally 1% to 4% (2009 – 2% to 10%).
In the case of Poland, it is reasonably possible that a change in key assumptions would cause the goodwill to exceed its value in use. With headroom
of £46m (2009 – £84m) and assuming a 10.6% pre-tax discount rate (2009 – 11.3%), a 0.3% (2009 – 0.4%) increase in the discount rate would cause
goodwill to exceed its value in use.
The pre-tax discount rates used to calculate value in use range from 6%-14% (2009 – 7% to 24%). On a post-tax basis, the discount rates ranged from
4% to 13% (2009 – 5% to 19%). These discount rates are derived from the Group’s post-tax weighted average cost of capital as adjusted for the specific
risks relating to each geographical region.
In February 2010 and 2009 impairment reviews were performed by comparing the carrying value of goodwill with the recoverable amount of the cash-
generating units to which goodwill has been allocated.
The components of goodwill are as follows:
2010 2009
Restated
£m £m
UK 645 616
Tesco Bank 802 802
Thailand 157 153
South Korea 489 392
Japan 55 196
China 594 540
Malaysia 77 76
Poland 424 354
Czech Republic 35 47
Turkey 54 53
Other 5 5
3,337 3,234
Tesco PLC Annual Report and Financial Statements 2010 91