Tesco 2010 Annual Report Download - page 120
Download and view the complete annual report
Please find page 120 of the 2010 Tesco annual report below. You can navigate through the pages in the report by either clicking on the pages listed below, or by using the keyword search tool below to find specific information within the annual report.-
 1
1 -
2
-
3
-
4
-
5
-
6
-
7
-
8
-
9
-
10
-
11
-
12
-
13
-
14
-
15
-
16
-
17
-
18
-
19
-
20
-
21
-
22
-
23
-
24
-
25
-
26
-
27
-
28
-
29
-
30
-
31
-
32
-
33
-
34
-
35
-
36
-
37
-
38
-
39
-
40
-
41
-
42
-
43
-
44
-
45
-
46
-
47
-
48
-
49
-
50
-
51
-
52
-
53
-
54
-
55
-
56
-
57
-
58
-
59
-
60
-
61
-
62
-
63
-
64
-
65
-
66
-
67
-
68
-
69
-
70
-
71
-
72
-
73
-
74
-
75
-
76
-
77
-
78
-
79
-
80
-
81
-
82
-
83
-
84
-
85
-
86
-
87
-
88
-
89
-
90
-
91
-
92
-
93
-
94
-
95
-
96
-
97
-
98
-
99
-
100
-
101
-
102
-
103
-
104
-
105
-
106
-
107
-
108
-
109
-
 110
110 -
 111
111 -
 112
112 -
 113
113 -
 114
114 -
 115
115 -
 116
116 -
 117
117 -
 118
118 -
 119
119 -
 120
120 -
 121
121 -
 122
122 -
 123
123 -
 124
124 -
 125
125 -
 126
126 -
 127
127 -
 128
128 -
 129
129 -
 130
130 -
131
-
132
-
133
-
134
-
135
-
136
 |
 |

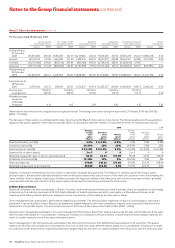
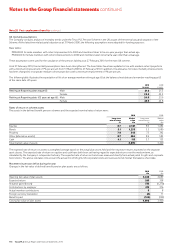
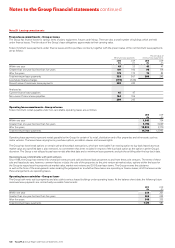
Notes to the Group financial statements continued
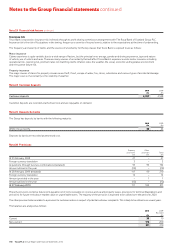
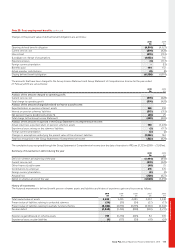
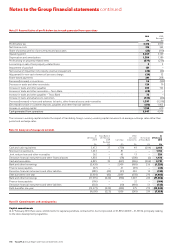
Note 31 Reconciliation of profit before tax to cash generated from operations
2010 2009
Restated
£m £m
Profit before tax 3,176 2,917
Net finance costs 314 362
Share of post-tax profits of joint ventures and associates (33) (110)
Operating profit 3,457 3,169
Depreciation and amortisation 1,384 1,189
Profit arising on property-related items (377) (236)
Loss arising on sale of non property-related items 5 3
Impairment of goodwill 131 –
Net reversal of impairment of property, plant and equipment (26) (22)
Adjustment for non-cash element of pensions charge (24) 52
Share-based payments 241 208
Decrease/(increase) in inventories 34 (95)
Decrease in trade and other receivables 124 79
Increase in trade and other payables 453 724
Increase in trade and other receivables – Tesco Bank (28) –
Increase in trade and other payables – Tesco Bank 75 –
Increase in loans and advances to customers (724) (20)
Decrease/(increase) in loans and advances to banks, other financial assets and receivables 1,397 (1,538)
(Decrease)/increase in customer deposits, payables and other financial liabilities (175) 1,465
Increase in working capital 1,156 619
Cash generated from operations 5,947 4,978
The increase in working capital includes the impact of translating foreign currency working capital movements at average exchange rates rather than
period end exchange rates.
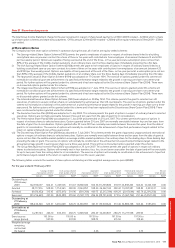
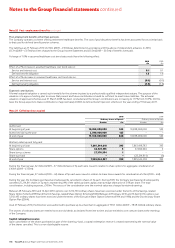
Note 32 Analysis of changes in net debt
At Tesco Bank at Other At
28 February 28 February non-cash Elimination 27 February
2009 2009 Cash flow movements of Tesco Bank 2010
Restated
£m £m £m £m £m £m
Cash and cash equivalents 3,472 37 (739) 49 (204) 2,615
Short-term investments 1,233 – 81 – – 1,314
Joint venture loan and other receivables 262 – 45 13 – 320
Derivative financial instruments and other financial assets 1,858 2 (78) (308) (2) 1,472
Cash and receivables 6,825 39 (691) (246) (206) 5,721
Bank and other borrowings (3,424) – 2,909 (969) 256 (1,228)
Finance lease payables (47) – 41 (39) – (45)
Derivative financial instruments and other liabilities (483) (42) (51) 430 14 (132)
Debt due within one year (3,954) (42) 2,899 (578) 270 (1,405)
Bank and other borrowings (11,973) (222) (392) 1,007 224 (11,356)
Finance lease payables (196) – – 32 – (164)
Derivative financial instruments and other liabilities (302) – (10) (464) 51 (725)
Debt due after one year (12,471) (222) (402) 575 275 (12,245)
(9,600) (225) 1,806 (249) 339 (7,929)
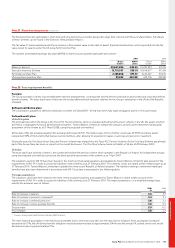
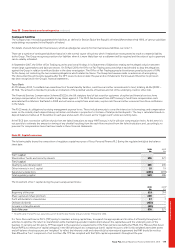
Note 33 Commitments and contingencies
Capital commitments
At 27 February 2010 there were commitments for capital expenditure contracted for, but not provided, of £1,835m (2009 – £1,551m), principally relating
to the store development programme.
118 Tesco PLC Annual Report and Financial Statements 2010