Tesco 2010 Annual Report Download - page 123
Download and view the complete annual report
Please find page 123 of the 2010 Tesco annual report below. You can navigate through the pages in the report by either clicking on the pages listed below, or by using the keyword search tool below to find specific information within the annual report.-
 1
1 -
2
-
3
-
4
-
5
-
6
-
7
-
8
-
9
-
10
-
11
-
12
-
13
-
14
-
15
-
16
-
17
-
18
-
19
-
20
-
21
-
22
-
23
-
24
-
25
-
26
-
27
-
28
-
29
-
30
-
31
-
32
-
33
-
34
-
35
-
36
-
37
-
38
-
39
-
40
-
41
-
42
-
43
-
44
-
45
-
46
-
47
-
48
-
49
-
50
-
51
-
52
-
53
-
54
-
55
-
56
-
57
-
58
-
59
-
60
-
61
-
62
-
63
-
64
-
65
-
66
-
67
-
68
-
69
-
70
-
71
-
72
-
73
-
74
-
75
-
76
-
77
-
78
-
79
-
80
-
81
-
82
-
83
-
84
-
85
-
86
-
87
-
88
-
89
-
90
-
91
-
92
-
93
-
94
-
95
-
96
-
97
-
98
-
99
-
100
-
101
-
102
-
103
-
104
-
105
-
106
-
107
-
108
-
109
-
110
-
111
-
112
-
 113
113 -
 114
114 -
 115
115 -
 116
116 -
 117
117 -
 118
118 -
 119
119 -
 120
120 -
 121
121 -
 122
122 -
 123
123 -
 124
124 -
 125
125 -
 126
126 -
 127
127 -
 128
128 -
 129
129 -
 130
130 -
 131
131 -
 132
132 -
 133
133 -
134
-
135
-
136
 |
 |

Financial statements
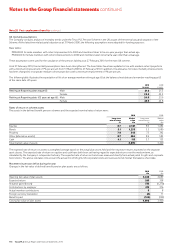
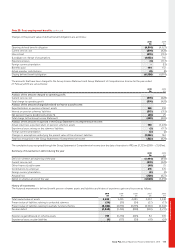
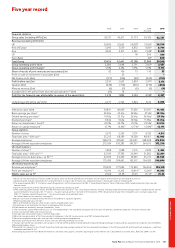
Five year record
20061 2007 2008
2009
Restated
2010
Financial statistics
Group sales (including VAT) (£m) 43,137 46,611 51,773 59,426 62,537
Revenue (excluding VAT) (£m)
UK 29,990 32,665 34,858637,650338,558
Rest of Europe 5,095 5,559 6,872 8,83158,704
Asia 4,369 4,417 5,552 7,04838,439
US – – 16
6206 349
Tesco Bank – – – 1636860
Total Group 39,454 42,641 47,298 53,898 56,910
Group operating profit2 (£m) 2,280 2,648 2,791 3,16933,457
Group operating profit margin25.8% 6.2% 5.9% 5.9% 6.1%
Share of results of joint ventures and associates (£m) 82 106 75 110 33
Profit on sale of investment in associates (£m) – 25 – – –
Net finance costs (£m) (127) (126) (63) (362) (314)
Profit before tax (£m) 2,235 2,653 2,803 2,91733,176
Taxation (£m) (649) (772) (673) (779) (840)
Minority interests (£m) (6) (7) (6) (5) (9)
(Loss)/profit for the period from discontinued operation4,5 (£m) (10) 18 – – –
Profit for the financial year attributable to owners of the parent (£m) 1,570 1,892 2,124 2,13332,327
Underlying profit before tax5 (£m) 2,277 2,545 2,846 3,124 3,395
Enterprise value7 (£m) 30,841 40,469 37,656 35,907 41,442
Basic earnings per share820.20p 23.61p 26.95p 27.14p329.33p
Diluted earnings per share819.92p 23.31p 26.61p 26.96p329.19p
Dividend per share98.63p 9.64p 10.90p 11.96p 13.05p
Return on shareholders’ funds10 24.9% 26.7% 25.1% 23.5%323.0%
Return on capital employed11 12.7% 12.6%
16 12.7%
17 12.8%
20 12.1%
Group statistics
Number of stores 2,672 3,263 3,751 4,332 4,811
Total sales area – 000 sq ft12 55,215 68,189 76,338 88,451 93,985
Average employees 368,213 413,061 444,127 468,508 472,094
Average full-time equivalent employees 273,024 318,283 345,737 364,015 372,338
UK retail statistics
Number of stores18 1,898 1,988 2,115 2,282 2,482
Total sales area – 000 sq ft12,18 25,919 27,785 29,549 31,285 32,991
Average store size (sales area – sq ft)13,18 32,816 34,209 35,055 35,215 35,485
Average full-time equivalent employees 175,459 184,461 193,917 194,420 196,604
UK retail productivity (£)
Revenue per employee14 170,923 177,084 179,840 196,4363196,120
Profit per employee14 10,190 11,292 10,814
19 13,065314,303
Weekly sales per sq ft15 25.06 25.48 25.43 25.34325.22
1 Results for the year ended 25 February 2006 include 52 weeks for the UK and ROI and 14 months for the majority of the remaining international businesses.
2 Operating profit includes integration costs and profit/(loss) arising on sale of fixed assets. Operating margin is based upon revenue excluding VAT.
3 The Group adopted IFRIC 13 ‘Customer Loyalty Programmes’ and the amendments to IFRS 2 ‘Share-Based Payment’ from 24 February 2008. Periods before this date have not
been restated.
4 Consists of the net result of the Taiwanese business which was sold during 2007.
5 IFRS underlying profit excludes IAS 32 and IAS 39 ‘Financial Instruments’ – fair value remeasurements, the IAS 19 Group Income Statement charge, which is replaced by the ‘normal’
cash contributions for pensions, IAS 17 ‘Leases’ – impact of annual uplifts in rent and rent-free periods, IFRS 3 Amortisation charge from intangible assets arising on acquisition,
IFRIC13 ‘Customer Loyalty Programmes’ – fair value of awards and exceptional items.
For further details of this measure, see page 81.
6 Results have been restated to reflect the US and Tesco Bank as separate segments.
7 Market capitalisation plus net debt.
8 Basic and diluted earnings per share are on a continuing operations basis.
9 Dividend per share relating to the interim and proposed final dividend.
10 Profit before tax divided by average shareholders’ funds.
11 The numerator is profit before interest, less tax. The denominator is the calculated average of net assets plus net debt plus dividend creditor less net assets held for sale.
12 Store sizes exclude lobby and restaurant areas.
13 Average store size excludes Express and One Stop stores.
14 Based on average number of full-time equivalent employees in the UK, revenue exclusive of VAT and operating profit.
15 Based on weighted average sales area and sales excluding property development.
16 Excludes one-off gain from ‘Pensions A-Day’, with this one-off gain ROCE was 13.6%.
17 Using a ‘normalised’ tax rate before start-up costs in the US and Tesco Direct and excluding the impact of foreign exchange in equity and our acquisition of a majority share of Dobbies.
18 Excluding Dobbies stores.
19 Excluding start-up costs in the US and Tesco Direct and adjusting average number of full-time equivalent employees in the UK to exclude US and Tesco Direct employees – profit per
employee would be £11,317.
20 Excluding acquisition of Tesco Bank and Homever, and India start-up costs, and after adjusting for assets held for sale. Calculated on a 52-week basis, ROCE for 2009 is 12.8%.
Tesco PLC Annual Report and Financial Statements 2010 121