Tesco 2010 Annual Report Download - page 129
Download and view the complete annual report
Please find page 129 of the 2010 Tesco annual report below. You can navigate through the pages in the report by either clicking on the pages listed below, or by using the keyword search tool below to find specific information within the annual report.-
 1
1 -
2
-
3
-
4
-
5
-
6
-
7
-
8
-
9
-
10
-
11
-
12
-
13
-
14
-
15
-
16
-
17
-
18
-
19
-
20
-
21
-
22
-
23
-
24
-
25
-
26
-
27
-
28
-
29
-
30
-
31
-
32
-
33
-
34
-
35
-
36
-
37
-
38
-
39
-
40
-
41
-
42
-
43
-
44
-
45
-
46
-
47
-
48
-
49
-
50
-
51
-
52
-
53
-
54
-
55
-
56
-
57
-
58
-
59
-
60
-
61
-
62
-
63
-
64
-
65
-
66
-
67
-
68
-
69
-
70
-
71
-
72
-
73
-
74
-
75
-
76
-
77
-
78
-
79
-
80
-
81
-
82
-
83
-
84
-
85
-
86
-
87
-
88
-
89
-
90
-
91
-
92
-
93
-
94
-
95
-
96
-
97
-
98
-
99
-
100
-
101
-
102
-
103
-
104
-
105
-
106
-
107
-
108
-
109
-
110
-
111
-
112
-
113
-
114
-
115
-
116
-
117
-
118
-
 119
119 -
 120
120 -
 121
121 -
 122
122 -
 123
123 -
 124
124 -
 125
125 -
 126
126 -
 127
127 -
 128
128 -
 129
129 -
 130
130 -
 131
131 -
 132
132 -
 133
133 -
 134
134 -
 135
135 -
 136
136
 |
 |

Financial statements
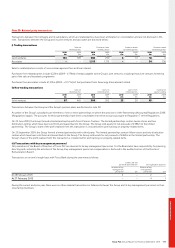
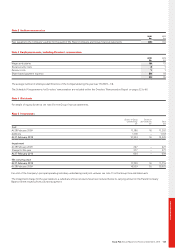
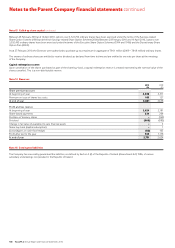
Note 9 Borrowings
Maturity 2010 2009
Par value year £m £m
Bank loans and overdrafts – – 27 1,494
Loans from joint ventures – – 17 9
5.125% MTN £192m 2009 – 198
6.625% MTN £150m 2010 158 154
4.75% MTN €750m 2010 704 689
3.875% MTN €500m 2011 479 476
5.625% MTN €1,500m 2012 1,375 1,362
5% MTN £600m 2014 604 592
5.125% MTN €600m 2015 539 522
4% RPI MTN(a) £263m 2016 270 268
5.875% MTN €1,500m 2016 1,520 1,488
5.5% USD Bond $850m 2017 621 678
5.5% MTN £350m 2019 351 351
6.125% MTN £900m 2022 890 901
5% MTN £515m 2023 520 515
3.322% LPI MTN(b) £265m 2025 269 267
6% MTN £200m 2029 212 216
5.5% MTN £200m 2033 210 216
1.982% RPI MTN(c) £221m 2036 222 221
6.15% USD Bond $1,150m 2037 834 977
5% MTN £300m 2042 306 306
5.125% MTN €600m 2047 587 628
5.2% MTN £500m 2057 500 500
Other MTNs – – 291 477
Other loans – – 231 226
11,737 13,731
(a) The 4% RPI MTN is redeemable at par, indexed for increases in the Retail Price Index (RPI) over the life of the MTN.
(b) The 3.322% LPI MTN is redeemable at par, indexed for increases in the RPI over the life of the MTN. The maximum indexation of the principal in any one year is 5%, with a minimum of 0%.
(c) The 1.982% RPI MTN is redeemable at par, indexed for increases in the RPI over the life of the MTN.
2010 2009
£m £m
Repayment analysis:
Amounts falling due within one year 932 1,981
932 1,981
Amounts falling due after more than one year:
Amounts falling due between one and two years 699 867
Amounts falling due between two and five years 2,795 2,784
Amounts falling due after more than five years 7,311 8,099
10,805 11,750
11,737 13,731
Tesco PLC Annual Report and Financial Statements 2010 127