Tesco 2002 Annual Report Download - page 4
Download and view the complete annual report
Please find page 4 of the 2002 Tesco annual report below. You can navigate through the pages in the report by either clicking on the pages listed below, or by using the keyword search tool below to find specific information within the annual report.-
 1
1 -
 2
2 -
 3
3 -
 4
4 -
 5
5 -
 6
6 -
 7
7 -
 8
8 -
 9
9 -
 10
10 -
 11
11 -
 12
12 -
 13
13 -
 14
14 -
 15
15 -
16
-
17
-
18
-
19
-
20
-
21
-
22
-
23
-
24
-
25
-
26
-
27
-
28
-
29
-
30
-
31
-
32
-
33
-
34
-
35
-
36
-
37
-
38
-
39
-
40
-
41
-
42
-
43
-
44
 |
 |

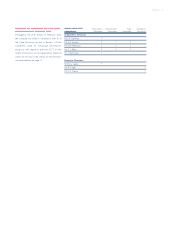
TESCO SHARE PRICE OVER LAST 3 YEARS pence
253.50
168.75
Feb 99 Feb 00 Feb 01 Feb 02
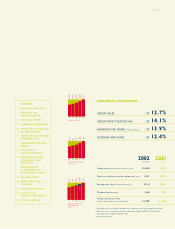
GROUP SUMMARY
2002 2001 Change
£m £m %
Group sales
(including value added tax) 25,654 22,773 12.7
Group operating profit
(prior to goodwill amortisation) 1,332 1,174 13.5
Profit on ordinary activities
before tax†1,221 1,070 14.1
Adjusted diluted earnings
per share†12.14p 10.66p‡13.9
Dividend per share 5.60p 4.98p 12.4
UK PERFORMANCE
2002 2001 Change
£m £m %
Sales
(including value added tax) 21,685 19,884 9.1
Operating profit 1,213 1,100 10.3
REST OF EUROPE PERFORMANCE
2002 2001 Change
£m £m %
Sales
(including value added tax) 2,475 1,970 25.6
Operating profit 90 70 28.6
ASIA PERFORMANCE
2002 2001 Change
£m £m %
Sales
(including value added tax) 1,494 919 62.6
Operating profit 29 4 625.0
†Excluding net loss on disposal of fixed assets and goodwill
amortisation.
‡Restated due to the adoption of FRS 19, ‘Deferred Tax’.
* 52 weeks pro forma.
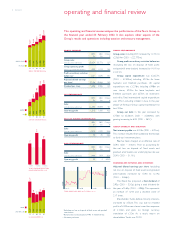
2TESCO PLC operating and financial review
This operating and financial review analyses the performance of the Tesco Group in
the financial year ended 23 February 2002. It also explains other aspects of the
Group’s results and operations including taxation and treasury management.
GROUP PERFORMANCE
Group sales including VAT increased by 12.7% to
£25,654m (2001 – £22,773m).
Group profit on ordinary activities before tax
(excluding net loss on disposal of fixed assets
and goodwill amortisation) increased by 14.1% to
£1,221m.
Group capital expenditure was £2,027m
(2001 – £1,944m) including £219m for lease
buybacks and freehold purchases. UK capital
expenditure was £1,276m, including £498m on
new stores, £219m for lease buybacks and
freehold purchases and £270m on extensions
and refits. Total international capital expenditure
was £751m including £426m in Asia. In the year
ahead we forecast Group capital expenditure to
be £2.0bn.
Group net debt in the year increased by
£756m to £3,560m (2001 – £2,804m), with
gearing increasing to 64% (2001 – 56%‡).
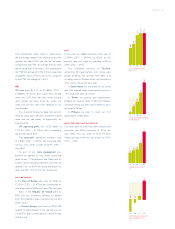
GROUP INTEREST AND TAXATION
Net interest payable was £153m (2001 – £125m).
This increase resulted from additional borrowings
to fund our investment plans.
Ta x has been charged at an effective rate of
30.9% (2001 – 31.6%‡). Prior to accounting for
the net loss on disposal of fixed assets and
goodwill amortisation, our underlying tax rate was
30.4% (2001 – 31.1%‡).
SHAREHOLDER RETURNS AND DIVIDENDS
Adjusted diluted earnings per share (excluding
net loss on disposal of fixed assets and goodwill
amortisation) increased by 13.9% to 12.14p
(2001 – 10.66p‡).
The Board has proposed a final dividend of
3.93p (2001 – 3.50p) giving a total dividend for
the year of 5.60p (2001 – 4.98p).This represents
an increase of 12.4% and a dividend cover of
2.17 times.
Shareholders’ funds, before minority interests,
increased by £552m. This was due to retained
profits of £440m, new shares issued less expenses
of £100m, and gains on foreign currency
translation of £12m. As a result, return on
shareholders’ funds was 23.2%.
98 99 00 0201
GROUP PERFORMANCE £m
25,654
22,773
20,358
18,546
17,447*
21,685
19,884
18,334
17,091
15,818*
GROUP SALES
UK SALES
98 99 00 0201
CAPITAL EXPENDITURE £m
2,027
1,944
1,488
1,067
841
1,276
1,206
989
848
757
GROUP
UK
1 year 3 years 5 years
TOTAL SHAREHOLDER RETURN
RELATIVE TO THE FTSE 100 %
14.0
17.7
11.6
98 99 00 0201
UK SALES GROWTH %
9.1
8.5
7.4
8.0
12.7*
6.2
4.8
4.2
4.0
6.1*
TOTAL
LIKE FOR LIKE