Tesco 2002 Annual Report Download - page 38
Download and view the complete annual report
Please find page 38 of the 2002 Tesco annual report below. You can navigate through the pages in the report by either clicking on the pages listed below, or by using the keyword search tool below to find specific information within the annual report.-
 1
1 -
2
-
3
-
4
-
5
-
6
-
7
-
8
-
9
-
10
-
11
-
12
-
13
-
14
-
15
-
16
-
17
-
18
-
19
-
20
-
21
-
22
-
23
-
24
-
25
-
26
-
27
-
 28
28 -
 29
29 -
 30
30 -
 31
31 -
 32
32 -
 33
33 -
 34
34 -
 35
35 -
 36
36 -
 37
37 -
 38
38 -
 39
39 -
 40
40 -
 41
41 -
 42
42 -
 43
43 -
 44
44
 |
 |

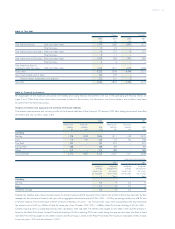
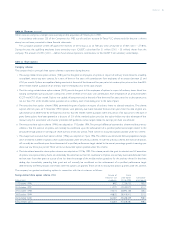
36 TESCO PLC notes to the financial statements continued
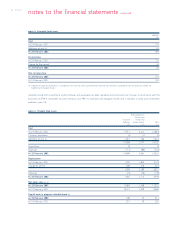
NOTE 26 Share options continued
Irish savings-related share option scheme (2000) Number of Shares
executives and under option Subscription
Date of grant employees 23 Feb 2002 price (pence)
2 June 2000 1,911 1,941,896 163.0
26 October 2000 872 661,585 198.0
8 November 2001 777 648,573 198.0
Tesco PLC has taken advantage of the exemptions applicable to Inland Revenue approved SAYE share option schemes and equivalent overseas
schemes under Urgent Issues Task Force Abstract 17 (revised 2000), ‘Employee Share Schemes’.
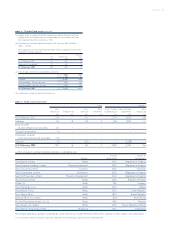
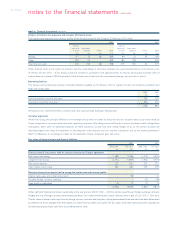
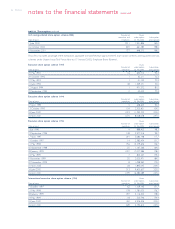
Executive share option scheme (1984)Shares
Number of under option Subscription
Date of grant executives 23 Feb 2002 price (pence)
29 May 1992 16 630,710 92.3
29 October 1992 1 62,211 72.3
27 May 1993 1 51,150 72.3
10 June 1994 48 1,349,271 70.0
12 August 1994 1 471,372 81.0
29 September 1994 2 42,000 77.3
Executive share option scheme (1994)Shares
Number of under option Subscription
Date of grant executives 23 Feb 2002 price (pence)
27 April 1995 5 638,625 90.3
13 October 1995 104 2,505,601 104.0
26 June 2000 1,323 11,290,700 205.0
26 April 2001 1,270 8,028,058 247.0
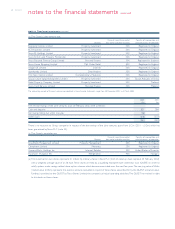
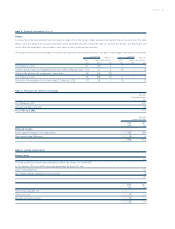
Executive share option scheme (1996)Shares
Number of under option Subscription
Date of grant executives 23 Feb 2002 price (pence)
3 July 1996 4 888,903 98.3
23 September 1996 148 3,977,516 99.7
17 April 1997 291 5,083,198 117.7
7 October 1997 14 2,383,434 151.7
21 May 1998 756 13,279,656 176.7
30 September 1998 25 1,167,566 164.0
28 January 1999 1,022 17,027,986 178.0
24 May 1999 7 823,247 179.4
9 November 1999 35 2,000,471 184.0
30 November 1999 8 1,098,962 173.0
20 April 2000 28 1,893,045 209.5
26 June 2000 313 9,600,657 205.0
26 April 2001 1,199 16,380,089 247.0
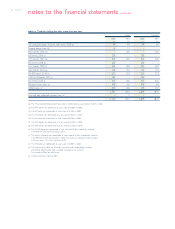
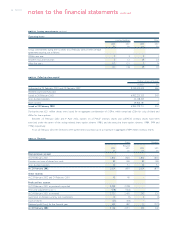
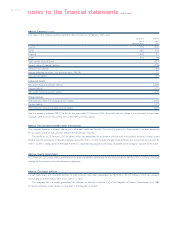
International executive share option scheme (1994) Shares
Number of under option Subscription
Date of grant executives 23 Feb 2002 price (pence)
7 October 1997 62 1,109,190 151.7
21 May 1998 178 1,781,000 176.7
28 January 1999 297 3,116,500 178.0
24 May 1999 18 520,746 179.4
26 June 2000 400 4,926,406 205.0
26 April 2001 649 4,190,614 247.0