Tesco 2002 Annual Report Download - page 18
Download and view the complete annual report
Please find page 18 of the 2002 Tesco annual report below. You can navigate through the pages in the report by either clicking on the pages listed below, or by using the keyword search tool below to find specific information within the annual report.-
 1
1 -
2
-
3
-
4
-
5
-
6
-
7
-
 8
8 -
 9
9 -
 10
10 -
 11
11 -
 12
12 -
 13
13 -
 14
14 -
 15
15 -
 16
16 -
 17
17 -
 18
18 -
 19
19 -
 20
20 -
 21
21 -
 22
22 -
 23
23 -
 24
24 -
 25
25 -
 26
26 -
 27
27 -
 28
28 -
29
-
30
-
31
-
32
-
33
-
34
-
35
-
36
-
37
-
38
-
39
-
40
-
41
-
42
-
43
-
44
 |
 |

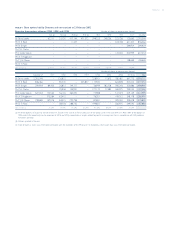
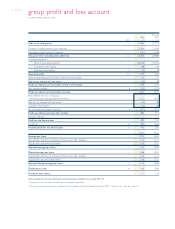
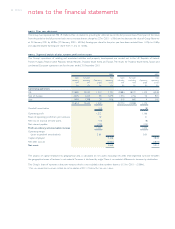
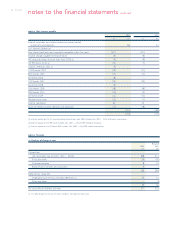
16 TESCO PLC group profit and loss account
52 weeks ended 23 February 2002
Restated‡
2002 2001
note £m £m
Sales at net selling prices 225,654 22,773
Turnover including share of joint ventures 23,804 21,096
Less: share of joint ventures’ turnover (151) (108)
Group turnover excluding value added tax 2/3 23,653 20,988
Operating expenses
– Normal operating expenses (22,273) (19,770)
– Employee profit-sharing 4(48) (44)
– Goodwill amortisation 12 (10) (8)
Operating profit 2/3 1,322 1,166
Share of operating profit of joint ventures and associates 42 21
Net loss on disposal of fixed assets (10) (8)
Profit on ordinary activities before interest and taxation 1,354 1,179
Net interest payable 8(153) (125)
Profit on ordinary activities before taxation 51,201 1,054
Profit before net loss on disposal
of fixed assets and goodwill amortisation 1,221 1,070
Net loss on disposal of fixed assets (10) (8)
Goodwill amortisation (10) (8)
Tax on profit on ordinary activities 9(371) (333)
Profit on ordinary activities after taxation 830 721
Minority interests –1
Profit for the financial year 830 722
Dividends 10 (390) (340)
Retained profit for the financial year 25 440 382
Pence Pence
Earnings per share 11 12.05 10.63
Adjusted for net loss on disposal of fixed assets after taxation 0.14 0.12
Adjusted for goodwill amortisation 0.14 0.12
Adjusted earnings per share†11 12.33 10.87
Diluted earnings per share 11 11.86 10.42
Adjusted for net loss on disposal of fixed assets after taxation 0.14 0.12
Adjusted for goodwill amortisation 0.14 0.12
Adjusted diluted earnings per share†11 12.14 10.66
Dividend per share 10 5.60 4.98
Dividend cover (times) 2.17 2.14
Accounting policies and notes forming part of these financial statements are on pages 20 to 39.
†Excluding net loss on disposal of fixed assets and goodwill amortisation.
‡Prior year comparatives have been restated due to the adoption of Financial Reporting Standard (FRS) 19, ‘Deferred Tax’. See note 1 page 22.