Tesco 2002 Annual Report Download - page 33
Download and view the complete annual report
Please find page 33 of the 2002 Tesco annual report below. You can navigate through the pages in the report by either clicking on the pages listed below, or by using the keyword search tool below to find specific information within the annual report.-
 1
1 -
2
-
3
-
4
-
5
-
6
-
7
-
8
-
9
-
10
-
11
-
12
-
13
-
14
-
15
-
16
-
17
-
18
-
19
-
20
-
21
-
22
-
 23
23 -
 24
24 -
 25
25 -
 26
26 -
 27
27 -
 28
28 -
 29
29 -
 30
30 -
 31
31 -
 32
32 -
 33
33 -
 34
34 -
 35
35 -
 36
36 -
 37
37 -
 38
38 -
 39
39 -
 40
40 -
 41
41 -
 42
42 -
 43
43 -
44
 |
 |

TESCO PLC 31
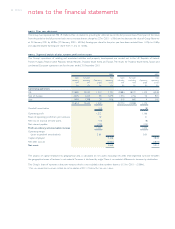
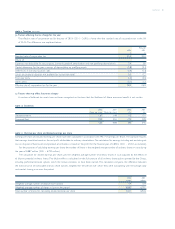
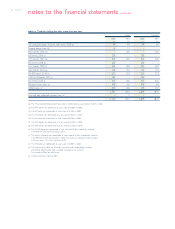
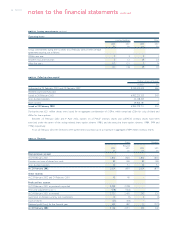
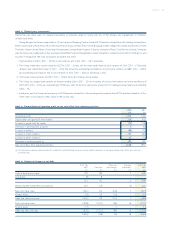
NOTE 20 Net debt
Group Company
2002 2001 2002 2001
£m £m £m £m
Due within one year: Bank and other loans 1,474 1,389 1,890 1,312
Finance leases 15 24 – –
Due within one to two years: Bank and other loans 15 207 15 207
Finance leases 9 11 – –
Due within two to five years: Bank and other loans 1,059 284 941 284
Finance leases 56––
Due otherwise than by
instalments after five years: Bank and other loans 1,653 1,417 1,653 1,328
Gross debt 4,230 3,338 4,499 3,131
Less: Cash at bank and in hand 445 279 – –
Money market investments and deposits 225 255 5 2
Net debt 3,560 2,804 4,494 3,129
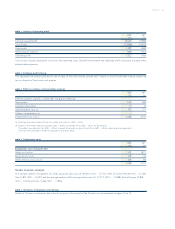
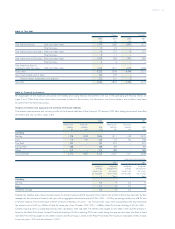
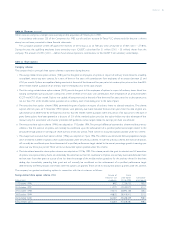
NOTE 21 Financial instruments
An explanation of the objectives and policies for holding and issuing financial instruments is set out in the operating and financial review on
pages 2 to 4. Other than where these items have been included in the currency risk disclosures, short-term debtors and creditors have been
excluded from the following analysis.
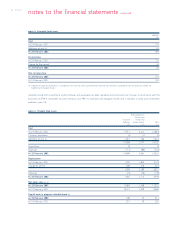
Analysis of interest rate exposure and currency of financial liabilities
The interest rate exposure and currency profile of the financial liabilities of the Group at 23 February 2002 after taking into account the effect
of interest rate and currency swaps were:
2002 2001
Floating rate Fixed rate Floating rate Fixed rate
liabilities liabilities Total liabilities liabilities Total
£m £m £m £m £m £m
Currency
Sterling 1,358 1,508 2,866 1,311 1,159 2,470
Euro 116 147 263 16 152 168
Thai Baht 394 – 394 323 – 323
Korean Won 388 – 388 89 – 89
Other 319 – 319 288 – 288
Gross liabilities 2,575 1,655 4,230 2,027 1,311 3,338
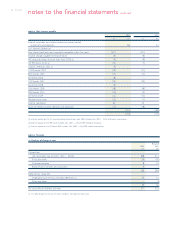
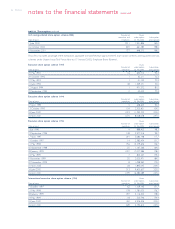
Fixed rate financial liabilities
2002 2001
Weighted Weighted Weighted Weighted
average average time average average time
interest rate for which interest rate for which
23 Feb 2002 rate is fixed 24 Feb 2001 rate is fixed
% Years % Years
Currency
Sterling 6.4 9 6.5 9
Euro 5.7 2 5.7 2
Weighted average 6.4 9 6.5 9
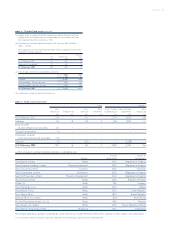
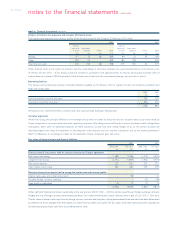
Floating rate liabilities bear interest at rates based on relevant national LIBOR equivalents.The interest rate profile of the Group has been further
managed by the purchase of interest rate caps with an aggregate notional principal of £100m (2001 – £100m), an average strike price of 8.3% and
a half year maturity. The current value of these contracts, if realised, is nil (2001 – nil). Forward start swaps were outstanding at the year end, fixing
the interest cost at 6.3% on £300m of debt for three years from October 2002 (2001 – £685m). Retail Price Index funding of £210m (2001 –
£203m), maturing 2016, is outstanding and has been classified as fixed rate debt.The interest rate payable on this debt is 4.0% and the principal is
linked to the Retail Price Index. Limited Price Index funding of £162m, maturing 2025, was issued during the year and has been classified as fixed
rate debt.The interest payable on this debt is 3.322% and the principal is linked to the Retail Price Index.The maximum indexation of the principal
in any one year is 5.0% and the minimum is 0.0%.