Tesco 2002 Annual Report Download - page 24
Download and view the complete annual report
Please find page 24 of the 2002 Tesco annual report below. You can navigate through the pages in the report by either clicking on the pages listed below, or by using the keyword search tool below to find specific information within the annual report.-
 1
1 -
2
-
3
-
4
-
5
-
6
-
7
-
8
-
9
-
10
-
11
-
12
-
13
-
 14
14 -
 15
15 -
 16
16 -
 17
17 -
 18
18 -
 19
19 -
 20
20 -
 21
21 -
 22
22 -
 23
23 -
 24
24 -
 25
25 -
 26
26 -
 27
27 -
 28
28 -
 29
29 -
 30
30 -
 31
31 -
 32
32 -
 33
33 -
 34
34 -
35
-
36
-
37
-
38
-
39
-
40
-
41
-
42
-
43
-
44
 |
 |

22 TESCO PLC notes to the financial statements
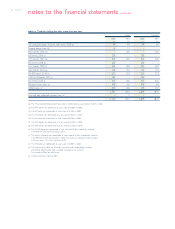
NOTE 1 Prior year adjustment
The Group has implemented FRS 19,‘Deferred Tax’, in relation to providing for deferred tax on the full provision basis.The impact of the move
from the partial to the full provision basis was to increase the tax charge by £27m (2001 – £45m) and to decrease the value of Group Reserves
at 25 February 2001 by £378m (27 February 2000 – £333m). Earnings per share for the prior year have been restated from 11.29p to 10.63p
and adjusted diluted earnings per share from 11.31p to 10.66p.
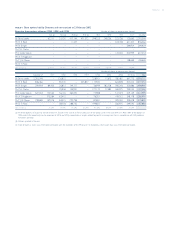
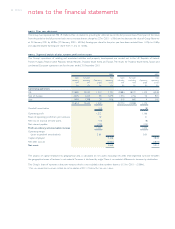
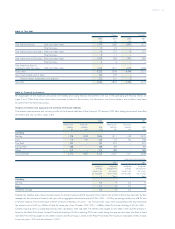
NOTE 2 Segmental analysis of sales, turnover, profit and net assets
The Group’s operations of retailing and associated activities and property development are carried out in the UK, Republic of Ireland,
France, Hungary, Poland, Czech Republic, Slovak Republic, Thailand, South Korea and Taiwan.The results for Thailand, South Korea,Taiwan and
continental European operations are for the year ended 31 December 2001.
2002 2001
Sales Turnover Net Sales Turnover Net
including excluding Operating operating including excluding Operating operating
VAT VAT profit assets VAT VAT profit assets‡
£m £m £m £m £m £m £m £m
Continuing operations
UK 21,685 20,052 1,213 7,131 19,884 18,372 1,100 6,348
Rest of Europe 2,475 2,203 90 1,079 1,970 1,756 70 925
Asia 1,494 1,398 29 916 919 860 4 545
25,654 23,653 1,332 22,773 20,988 1,174
Goodwill amortisation (10) (8)
Operating profit 1,322 1,166
Share of operating profit from joint ventures 42 21
Net loss on disposal of fixed assets (10) (8)
Net interest payable (153) (125)
Profit on ordinary activities before taxation 1,201 1,054
Operating margin
(prior to goodwill amortisation) 5.6% 5.6%
Capital employed 9,126 7,818
Net debt (note 20) (3,560) (2,804)
Net assets 5,566 5,014
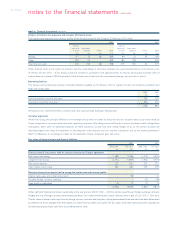
The analysis of capital employed by geographical area is calculated on net assets excluding net debt. Inter-segmental turnover between
the geographical areas of business is not material.Turnover is disclosed by origin.There is no material difference in turnover by destination.
The Group’s share of turnover in the joint ventures which is not included in the numbers above is £151m (2001 – £108m).
‡Prior year comparatives have been restated due to the adoption of FRS 19, ‘Deferred Tax’. See note 1 above.