Telstra 2007 Annual Report Download - page 7
Download and view the complete annual report
Please find page 7 of the 2007 Telstra annual report below. You can navigate through the pages in the report by either clicking on the pages listed below, or by using the keyword search tool below to find specific information within the annual report.-
 1
1 -
 2
2 -
 3
3 -
 4
4 -
 5
5 -
 6
6 -
 7
7 -
 8
8 -
 9
9 -
 10
10 -
 11
11 -
 12
12 -
 13
13 -
 14
14 -
 15
15 -
 16
16 -
 17
17 -
 18
18 -
19
-
20
-
21
-
22
-
23
-
24
-
25
-
26
-
27
-
28
-
29
-
30
-
31
-
32
-
33
-
34
-
35
-
36
-
37
-
38
-
39
-
40
-
41
-
42
-
43
-
44
-
45
-
46
-
47
-
48
-
49
-
50
-
51
-
52
-
53
-
54
-
55
-
56
-
57
-
58
-
59
-
60
-
61
-
62
-
63
-
64
-
65
-
66
-
67
-
68
-
69
-
70
-
71
-
72
-
73
-
74
-
75
-
76
-
77
-
78
-
79
-
80
-
81
-
82
-
83
-
84
-
85
-
86
-
87
-
88
-
89
-
90
-
91
-
92
-
93
-
94
-
95
-
96
-
97
-
98
-
99
-
100
-
101
-
102
-
103
-
104
-
105
-
106
-
107
-
108
-
109
-
110
-
111
-
112
-
113
-
114
-
115
-
116
-
117
-
118
-
119
-
120
-
121
-
122
-
123
-
124
-
125
-
126
-
127
-
128
-
129
-
130
-
131
-
132
-
133
-
134
-
135
-
136
-
137
-
138
-
139
-
140
-
141
-
142
-
143
-
144
-
145
-
146
-
147
-
148
-
149
-
150
-
151
-
152
-
153
-
154
-
155
-
156
-
157
-
158
-
159
-
160
-
161
-
162
-
163
-
164
-
165
-
166
-
167
-
168
-
169
-
170
-
171
-
172
-
173
-
174
-
175
-
176
-
177
-
178
-
179
-
180
-
181
-
182
-
183
-
184
-
185
-
186
-
187
-
188
-
189
-
190
-
191
-
192
-
193
-
194
-
195
-
196
-
197
-
198
-
199
-
200
-
201
-
202
-
203
-
204
-
205
-
206
-
207
-
208
-
209
-
210
-
211
-
212
-
213
-
214
-
215
-
216
-
217
-
218
-
219
-
220
-
221
-
222
-
223
-
224
-
225
-
226
-
227
-
228
-
229
-
230
-
231
-
232
-
233
-
234
-
235
-
236
-
237
-
238
-
239
-
240
-
241
-
242
-
243
-
244
-
245
-
246
-
247
-
248
-
249
-
250
-
251
-
252
-
253
-
254
-
255
-
256
-
257
-
258
-
259
-
260
-
261
-
262
-
263
-
264
-
265
-
266
-
267
-
268
-
269
 |
 |

4
Telstra Corporation Limited and controlled entities
Full year results and operations review - June 2007
Summary financial information
Results of operations
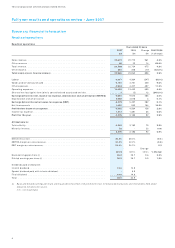
(i) Basic and diluted earnings per share are impacted by the effect of shares held in trust for employee share plans and instruments held under
executive remuneration plans.
n/m - not meaningful
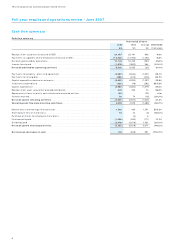
Results of operations
Year ended 30 June
2007 2006 Change 2007/2006
$m $m $m (% change)
Sales revenue. . . . . . . . . . . . . . . . . . . . . . . . . . . . . . . . . . . . . . . . . . . . . . . . 23,673 22,712 961 4.2%
Other revenue . . . . . . . . . . . . . . . . . . . . . . . . . . . . . . . . . . . . . . . . . . . . . . . 36 22 14 63.6%
Total revenue. . . . . . . . . . . . . . . . . . . . . . . . . . . . . . . . . . . . . . . . . . . . . . . . 23,709 22,734 975 4.3%
Other income. . . . . . . . . . . . . . . . . . . . . . . . . . . . . . . . . . . . . . . . . . . . . . . . 251 328 (77) (23.5%)
Total income (excl. finance income) . . . . . . . . . . . . . . . . . . . . . . . . . . . . . . . . . 23,960 23,062 898 3.9%
Labour . . . . . . . . . . . . . . . . . . . . . . . . . . . . . . . . . . . . . . . . . . . . . . . . . . . . 4,017 4,364 (347) (8.0%)
Goods and services purchased . . . . . . . . . . . . . . . . . . . . . . . . . . . . . . . . . . . . . 5,151 4,701 450 9.6%
Other expenses. . . . . . . . . . . . . . . . . . . . . . . . . . . . . . . . . . . . . . . . . . . . . . . 4,924 4,427 497 11.2%
Operating expenses. . . . . . . . . . . . . . . . . . . . . . . . . . . . . . . . . . . . . . . . . . . . 14,092 13,492 600 4.4%
Share of net loss/(gain) from jointly controlled and associated entities. . . . . . . . . . . . 7(5) 12 (240.0%)
Earnings before interest, income tax expense, depreciation and amortisation (EBITDA) 9,861 9,575 286 3.0%
Depreciation and amortisation . . . . . . . . . . . . . . . . . . . . . . . . . . . . . . . . . . . . . 4,082 4,078 4 0.1%
Earnings before interest & income tax expense (EBIT). . . . . . . . . . . . . . . . . . . . . . 5,779 5,497 282 5.1%
Net finance costs . . . . . . . . . . . . . . . . . . . . . . . . . . . . . . . . . . . . . . . . . . . . . 1,087 933 154 16.5%
Profit before income tax expense . . . . . . . . . . . . . . . . . . . . . . . . . . . . . . . . . . . 4,692 4,564 128 2.8%
Income tax expense. . . . . . . . . . . . . . . . . . . . . . . . . . . . . . . . . . . . . . . . . . . . 1,417 1,381 36 2.6%
Profit for the year . . . . . . . . . . . . . . . . . . . . . . . . . . . . . . . . . . . . . . . . . . . . . 3,275 3,183 92 2.9%
Attributable to:
Telstra Entity . . . . . . . . . . . . . . . . . . . . . . . . . . . . . . . . . . . . . . . . . . . . . . . . 3,253 3,183 70 2.2%
Minority interest . . . . . . . . . . . . . . . . . . . . . . . . . . . . . . . . . . . . . . . . . . . . . . 22 -22n/m
3,275 3,183 92 2.9%
Effective tax rate. . . . . . . . . . . . . . . . . . . . . . . . . . . . . . . . . . . . . . . . . . . . . . 30.2% 30.3% (0.1)
EBITDA margin on sales revenue . . . . . . . . . . . . . . . . . . . . . . . . . . . . . . . . . . . . 41.7% 42.2% (0.5)
EBIT margin on sales revenue. . . . . . . . . . . . . . . . . . . . . . . . . . . . . . . . . . . . . . 24.4% 24.2% 0.2
cents cent s
Change
cents % change
Basic earnings per share (i) . . . . . . . . . . . . . . . . . . . . . . . . . . . . . . . . . . . . . . . 26.3 25.7 0.6 2.3%
Diluted earnings per share (i) . . . . . . . . . . . . . . . . . . . . . . . . . . . . . . . . . . . . . . 26.2 25.7 0.5 1.9%
Dividends paid or declared:
Interim dividend . . . . . . . . . . . . . . . . . . . . . . . . . . . . . . . . . . . . . . . . . . . . . . 14.0 14.0
Special dividend paid with interim dividend . . . . . . . . . . . . . . . . . . . . . . . . . . . . . -6.0
Final dividend . . . . . . . . . . . . . . . . . . . . . . . . . . . . . . . . . . . . . . . . . . . . . . . 14.0 14.0
Total . . . . . . . . . . . . . . . . . . . . . . . . . . . . . . . . . . . . . . . . . . . . . . . . . . . . . 28.0 34.0