Telstra 2007 Annual Report Download - page 14
Download and view the complete annual report
Please find page 14 of the 2007 Telstra annual report below. You can navigate through the pages in the report by either clicking on the pages listed below, or by using the keyword search tool below to find specific information within the annual report.-
 1
1 -
2
-
3
-
 4
4 -
 5
5 -
 6
6 -
 7
7 -
 8
8 -
 9
9 -
 10
10 -
 11
11 -
 12
12 -
 13
13 -
 14
14 -
 15
15 -
 16
16 -
 17
17 -
 18
18 -
 19
19 -
 20
20 -
 21
21 -
 22
22 -
 23
23 -
 24
24 -
25
-
26
-
27
-
28
-
29
-
30
-
31
-
32
-
33
-
34
-
35
-
36
-
37
-
38
-
39
-
40
-
41
-
42
-
43
-
44
-
45
-
46
-
47
-
48
-
49
-
50
-
51
-
52
-
53
-
54
-
55
-
56
-
57
-
58
-
59
-
60
-
61
-
62
-
63
-
64
-
65
-
66
-
67
-
68
-
69
-
70
-
71
-
72
-
73
-
74
-
75
-
76
-
77
-
78
-
79
-
80
-
81
-
82
-
83
-
84
-
85
-
86
-
87
-
88
-
89
-
90
-
91
-
92
-
93
-
94
-
95
-
96
-
97
-
98
-
99
-
100
-
101
-
102
-
103
-
104
-
105
-
106
-
107
-
108
-
109
-
110
-
111
-
112
-
113
-
114
-
115
-
116
-
117
-
118
-
119
-
120
-
121
-
122
-
123
-
124
-
125
-
126
-
127
-
128
-
129
-
130
-
131
-
132
-
133
-
134
-
135
-
136
-
137
-
138
-
139
-
140
-
141
-
142
-
143
-
144
-
145
-
146
-
147
-
148
-
149
-
150
-
151
-
152
-
153
-
154
-
155
-
156
-
157
-
158
-
159
-
160
-
161
-
162
-
163
-
164
-
165
-
166
-
167
-
168
-
169
-
170
-
171
-
172
-
173
-
174
-
175
-
176
-
177
-
178
-
179
-
180
-
181
-
182
-
183
-
184
-
185
-
186
-
187
-
188
-
189
-
190
-
191
-
192
-
193
-
194
-
195
-
196
-
197
-
198
-
199
-
200
-
201
-
202
-
203
-
204
-
205
-
206
-
207
-
208
-
209
-
210
-
211
-
212
-
213
-
214
-
215
-
216
-
217
-
218
-
219
-
220
-
221
-
222
-
223
-
224
-
225
-
226
-
227
-
228
-
229
-
230
-
231
-
232
-
233
-
234
-
235
-
236
-
237
-
238
-
239
-
240
-
241
-
242
-
243
-
244
-
245
-
246
-
247
-
248
-
249
-
250
-
251
-
252
-
253
-
254
-
255
-
256
-
257
-
258
-
259
-
260
-
261
-
262
-
263
-
264
-
265
-
266
-
267
-
268
-
269
 |
 |

11
Telstra Corporation Limited and controlled entities
Full year results and operations review - June 2007
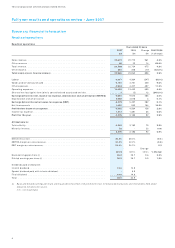
Fixed telephony
PSTN products
(i) Includes national long distance minutes from our public switched telephone network (PSTN) and independent ly operat ed payphones. Excludes minutes relat ed to
calls from non-PSTN networks, such as mobiles, ISDN and virtual private networks.
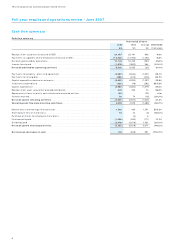
Fixed telephony
Year ended 30 June
2007 2006 Change 2007/2006
$m $m $m (% change)
PSTN products . . . . . . . . . . . . . . . . . . . . . . . . . . . . . . . . . . . . . . . . . . . . . . . 7,190 7,499 (309) (4.1%)
ISDN products . . . . . . . . . . . . . . . . . . . . . . . . . . . . . . . . . . . . . . . . . . . . . . . 749 806 (57) (7.1%)
Inbound calling products . . . . . . . . . . . . . . . . . . . . . . . . . . . . . . . . . . . . . . . . 413 414 (1) (0.2%)
Payphones . . . . . . . . . . . . . . . . . . . . . . . . . . . . . . . . . . . . . . . . . . . . . . . . . 92 104 (12) (11.5%)
Customer premises equipment . . . . . . . . . . . . . . . . . . . . . . . . . . . . . . . . . . . . . 318 274 44 16.1%
Intercarrier access services. . . . . . . . . . . . . . . . . . . . . . . . . . . . . . . . . . . . . . . . 181 152 29 19.1%
Other fixed telephony . . . . . . . . . . . . . . . . . . . . . . . . . . . . . . . . . . . . . . . . . . 317 318 (1) (0.3%)
Total fixed telephony revenue. . . . . . . . . . . . . . . . . . . . . . . . . . . . . . . . . . . . . 9,260 9,567 (307) (3.2%)
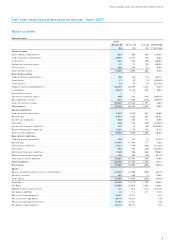
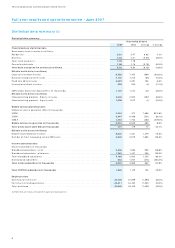
PSTN products
Year ended 30 June
2007 2006 Change 2007/2006
$m $m $m (% change)
Basic access revenue:
- Retail . . . . . . . . . . . . . . . . . . . . . . . . . . . . . . . . . . . . . . . . . . . . . . . . . . . . 2,587 2,591 (4) (0.2%)
- Domestic wholesale . . . . . . . . . . . . . . . . . . . . . . . . . . . . . . . . . . . . . . . . . . . 746 726 20 2.8%
Total basic access revenue. . . . . . . . . . . . . . . . . . . . . . . . . . . . . . . . . . . . . . . . 3,333 3,317 16 0.5%
Local call revenue . . . . . . . . . . . . . . . . . . . . . . . . . . . . . . . . . . . . . . . . . . . . . 845 1,023 (178) (17.4%)
PSTN value added services revenue . . . . . . . . . . . . . . . . . . . . . . . . . . . . . . . . . . 257 246 11 4.5%
National long distance call revenue. . . . . . . . . . . . . . . . . . . . . . . . . . . . . . . . . . 808 913 (105) (11.5%)
Fixed to mobile revenue . . . . . . . . . . . . . . . . . . . . . . . . . . . . . . . . . . . . . . . . . 1,487 1,490 (3) (0.2%)
International direct revenue . . . . . . . . . . . . . . . . . . . . . . . . . . . . . . . . . . . . . . 184 201 (17) (8.5%)
Fixed interconnection . . . . . . . . . . . . . . . . . . . . . . . . . . . . . . . . . . . . . . . . . . 276 309 (33) (10.7%)
Total PSTN products revenue. . . . . . . . . . . . . . . . . . . . . . . . . . . . . . . . . . . . . . 7,190 7,499 (309) (4.1%)
Basic access lines in service (in millions)
Residential . . . . . . . . . . . . . . . . . . . . . . . . . . . . . . . . . . . . . . . . . . . . . . . . . 5.53 5.47 0.06 1.1%
Business . . . . . . . . . . . . . . . . . . . . . . . . . . . . . . . . . . . . . . . . . . . . . . . . . . . 2.25 2.31 (0.06) (2.6%)
Total retail . . . . . . . . . . . . . . . . . . . . . . . . . . . . . . . . . . . . . . . . . . . . . . . . . 7.78 7.78 - -
Domestic wholesale. . . . . . . . . . . . . . . . . . . . . . . . . . . . . . . . . . . . . . . . . . . . 1.98 2.16 (0.18) (8.3%)
Total access lines in service . . . . . . . . . . . . . . . . . . . . . . . . . . . . . . . . . . . . . . . 9.76 9.94 (0.18) (1.8%)
Average revenue per user per month $'s . . . . . . . . . . . . . . . . . . . . . . . . . . . . . . . 60.83 62.30 (1.47) (2.4%)
Number of local calls (in millions) . . . . . . . . . . . . . . . . . . . . . . . . . . . . . . . . . . . 6,528 7,432 (904) (12.2%)
National long distance minutes (in millions) (i) . . . . . . . . . . . . . . . . . . . . . . . . . . . 7,130 7,215 (85) (1.2%)
Fixed to mobile minutes (in millions) . . . . . . . . . . . . . . . . . . . . . . . . . . . . . . . . . 4,687 4,491 196 4.4%
International direct minutes (in millions) . . . . . . . . . . . . . . . . . . . . . . . . . . . . . . 528 534 (6) (1.1%)
Note: statistical data represents management's best estimates.