Telstra 2007 Annual Report Download - page 21
Download and view the complete annual report
Please find page 21 of the 2007 Telstra annual report below. You can navigate through the pages in the report by either clicking on the pages listed below, or by using the keyword search tool below to find specific information within the annual report.-
 1
1 -
2
-
3
-
4
-
5
-
6
-
7
-
8
-
9
-
10
-
 11
11 -
 12
12 -
 13
13 -
 14
14 -
 15
15 -
 16
16 -
 17
17 -
 18
18 -
 19
19 -
 20
20 -
 21
21 -
 22
22 -
 23
23 -
 24
24 -
 25
25 -
 26
26 -
 27
27 -
 28
28 -
 29
29 -
 30
30 -
 31
31 -
32
-
33
-
34
-
35
-
36
-
37
-
38
-
39
-
40
-
41
-
42
-
43
-
44
-
45
-
46
-
47
-
48
-
49
-
50
-
51
-
52
-
53
-
54
-
55
-
56
-
57
-
58
-
59
-
60
-
61
-
62
-
63
-
64
-
65
-
66
-
67
-
68
-
69
-
70
-
71
-
72
-
73
-
74
-
75
-
76
-
77
-
78
-
79
-
80
-
81
-
82
-
83
-
84
-
85
-
86
-
87
-
88
-
89
-
90
-
91
-
92
-
93
-
94
-
95
-
96
-
97
-
98
-
99
-
100
-
101
-
102
-
103
-
104
-
105
-
106
-
107
-
108
-
109
-
110
-
111
-
112
-
113
-
114
-
115
-
116
-
117
-
118
-
119
-
120
-
121
-
122
-
123
-
124
-
125
-
126
-
127
-
128
-
129
-
130
-
131
-
132
-
133
-
134
-
135
-
136
-
137
-
138
-
139
-
140
-
141
-
142
-
143
-
144
-
145
-
146
-
147
-
148
-
149
-
150
-
151
-
152
-
153
-
154
-
155
-
156
-
157
-
158
-
159
-
160
-
161
-
162
-
163
-
164
-
165
-
166
-
167
-
168
-
169
-
170
-
171
-
172
-
173
-
174
-
175
-
176
-
177
-
178
-
179
-
180
-
181
-
182
-
183
-
184
-
185
-
186
-
187
-
188
-
189
-
190
-
191
-
192
-
193
-
194
-
195
-
196
-
197
-
198
-
199
-
200
-
201
-
202
-
203
-
204
-
205
-
206
-
207
-
208
-
209
-
210
-
211
-
212
-
213
-
214
-
215
-
216
-
217
-
218
-
219
-
220
-
221
-
222
-
223
-
224
-
225
-
226
-
227
-
228
-
229
-
230
-
231
-
232
-
233
-
234
-
235
-
236
-
237
-
238
-
239
-
240
-
241
-
242
-
243
-
244
-
245
-
246
-
247
-
248
-
249
-
250
-
251
-
252
-
253
-
254
-
255
-
256
-
257
-
258
-
259
-
260
-
261
-
262
-
263
-
264
-
265
-
266
-
267
-
268
-
269
 |
 |

18
Telstra Corporation Limited and controlled entities
Full year results and operations review - June 2007
Intercarrier access services
Our operating revenue from intercarrier fixed access products consists of revenue from facilities access,
unconditioned local loop, switch ports and interconnect network services, wholesale operator services, local
number portability and other wholesale access.
Intercarrier fixed access revenue increased by 19.1% to $181 million during the year ended 30 June 2007. The
main driver in the growth has been facilities access which has grown by 25.6% or $21 million due to other
carrier/service providers expanding their infrastructure by using Telstra Equipment and Building Access
(TEBA). TEBA sites have increased year on year by 44.3% as service providers seek to extend DSL capability
and prepare to build their own infrastructure.
Unconditioned local loop has increased by 26.1% or $8 million due to competitors building their own
networks. SIOs have increased by 99.2% from 120 thousand to 239 thousand during fiscal 2007 but revenue
is not reflective of this as regulatory pressure has led to a downward pricing adjustment. A number of
interim determinations were released by the Australian Competition and Consumer Commission (ACCC) in
the first half of fiscal 2007 which set a band 2 ULL price of $17.70 per month applicable to several customers.
This price has later been reduced in a draft final determination issued by the ACCC in June which is
substantially lower than the rates applicable in the prior year. Offsetting this growth is a decline of $4
million in other wholesale access products due to a reduction in commercial and pre-selection churn charges
and wholesale billing service charges.
Other fixed telephony
In the year ended 30 June 2007, revenue from other fixed telephony decreased by 0.3% to $317 million
mainly due to a decline in card services, virtual private networks and customnet and spectrum offset by an
increase in Telstra information and connection services.
Card services include postpaid card services, such as Homelink®, Telecard and OneNumber, and prepaid card
services, such as Prepaid Home, Phoneaway®, and Say G'day®. The decline in card services revenue reflects
an overall decline in the number of services due to substitution to cheaper and more convenient calling
products such as mobiles.
Virtual private network enables multi location customers to link premises in Australia and overseas to an
integrated system without the use of leased lines. Virtual private network revenue has decreased due to the
discounting of call rates arising from competitive pressures and call substitution like fixed to mobile, mobile
to mobile and SMS.
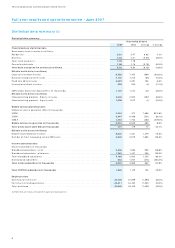
Intercarrier access services
Year ended 30 June
2007 2006 Change 2007/2006
$m $m $m (% change)
Intercarrier access services. . . . . . . . . . . . . . . . . . . . . . . . . . . . . . . . . . . . . . . . 181 152 29 19.1%
Other fixed telephony
Year ended 30 June
2007 2006 Change 2007/2006
$m $m $m (% change)
Telstra information and connection services . . . . . . . . . . . . . . . . . . . . . . . . . . . . 131 120 11 9.2%
Virtual private network . . . . . . . . . . . . . . . . . . . . . . . . . . . . . . . . . . . . . . . . . 12 17 (5) (29.4%)
International freecall™ . . . . . . . . . . . . . . . . . . . . . . . . . . . . . . . . . . . . . . . . . 77--
Card services . . . . . . . . . . . . . . . . . . . . . . . . . . . . . . . . . . . . . . . . . . . . . . . . 43 50 (7) (14.0%)
Satellite products . . . . . . . . . . . . . . . . . . . . . . . . . . . . . . . . . . . . . . . . . . . . . 17 14 3 21.4%
Customnet and spectrum . . . . . . . . . . . . . . . . . . . . . . . . . . . . . . . . . . . . . . . . 107 110 (3) (2.7%)
Total other fixed telephony revenue. . . . . . . . . . . . . . . . . . . . . . . . . . . . . . . . . 317 318 (1) (0.3%)