Telstra 2007 Annual Report Download - page 11
Download and view the complete annual report
Please find page 11 of the 2007 Telstra annual report below. You can navigate through the pages in the report by either clicking on the pages listed below, or by using the keyword search tool below to find specific information within the annual report.-
 1
1 -
 2
2 -
 3
3 -
 4
4 -
 5
5 -
 6
6 -
 7
7 -
 8
8 -
 9
9 -
 10
10 -
 11
11 -
 12
12 -
 13
13 -
 14
14 -
 15
15 -
 16
16 -
 17
17 -
 18
18 -
 19
19 -
 20
20 -
 21
21 -
 22
22 -
23
-
24
-
25
-
26
-
27
-
28
-
29
-
30
-
31
-
32
-
33
-
34
-
35
-
36
-
37
-
38
-
39
-
40
-
41
-
42
-
43
-
44
-
45
-
46
-
47
-
48
-
49
-
50
-
51
-
52
-
53
-
54
-
55
-
56
-
57
-
58
-
59
-
60
-
61
-
62
-
63
-
64
-
65
-
66
-
67
-
68
-
69
-
70
-
71
-
72
-
73
-
74
-
75
-
76
-
77
-
78
-
79
-
80
-
81
-
82
-
83
-
84
-
85
-
86
-
87
-
88
-
89
-
90
-
91
-
92
-
93
-
94
-
95
-
96
-
97
-
98
-
99
-
100
-
101
-
102
-
103
-
104
-
105
-
106
-
107
-
108
-
109
-
110
-
111
-
112
-
113
-
114
-
115
-
116
-
117
-
118
-
119
-
120
-
121
-
122
-
123
-
124
-
125
-
126
-
127
-
128
-
129
-
130
-
131
-
132
-
133
-
134
-
135
-
136
-
137
-
138
-
139
-
140
-
141
-
142
-
143
-
144
-
145
-
146
-
147
-
148
-
149
-
150
-
151
-
152
-
153
-
154
-
155
-
156
-
157
-
158
-
159
-
160
-
161
-
162
-
163
-
164
-
165
-
166
-
167
-
168
-
169
-
170
-
171
-
172
-
173
-
174
-
175
-
176
-
177
-
178
-
179
-
180
-
181
-
182
-
183
-
184
-
185
-
186
-
187
-
188
-
189
-
190
-
191
-
192
-
193
-
194
-
195
-
196
-
197
-
198
-
199
-
200
-
201
-
202
-
203
-
204
-
205
-
206
-
207
-
208
-
209
-
210
-
211
-
212
-
213
-
214
-
215
-
216
-
217
-
218
-
219
-
220
-
221
-
222
-
223
-
224
-
225
-
226
-
227
-
228
-
229
-
230
-
231
-
232
-
233
-
234
-
235
-
236
-
237
-
238
-
239
-
240
-
241
-
242
-
243
-
244
-
245
-
246
-
247
-
248
-
249
-
250
-
251
-
252
-
253
-
254
-
255
-
256
-
257
-
258
-
259
-
260
-
261
-
262
-
263
-
264
-
265
-
266
-
267
-
268
-
269
 |
 |

8
Telstra Corporation Limited and controlled entities
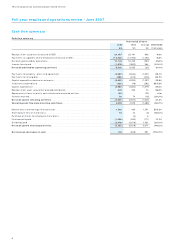
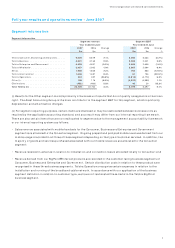
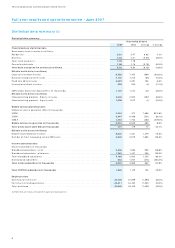
Full year results and operations review - June 2007
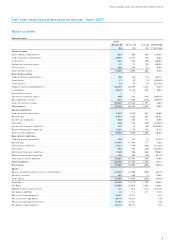
Statistical data summary (i)
(i) Refer detail of data included in each product section.
Statistical data summary
Year ended 30 June
2007 2006 Change % change
Fixed telephony statistical data
Basic access lines in service (in millions)
Residential . . . . . . . . . . . . . . . . . . . . . . . . . . . . . . . . . . . . . . . . . . . . . . . . . 5.53 5.47 0.06 1.1%
Business . . . . . . . . . . . . . . . . . . . . . . . . . . . . . . . . . . . . . . . . . . . . . . . . . . . 2.25 2.31 (0.06) (2.6%)
Total retail customers. . . . . . . . . . . . . . . . . . . . . . . . . . . . . . . . . . . . . . . . . . . 7.78 7.78 - -
Domestic wholesale. . . . . . . . . . . . . . . . . . . . . . . . . . . . . . . . . . . . . . . . . . . . 1.98 2.16 (0.18) (8.3%)
Total basic access lines in services (in millions) . . . . . . . . . . . . . . . . . . . . . . . . . . 9.76 9.94 (0.18) (1.8%)
Billable traffic data (in millions)
Local calls (number of calls). . . . . . . . . . . . . . . . . . . . . . . . . . . . . . . . . . . . . . . 6,528 7,432 (904) (12.2%)
National long distance minutes . . . . . . . . . . . . . . . . . . . . . . . . . . . . . . . . . . . . 7,130 7,215 (85) (1.2%)
Fixed to mobile minutes . . . . . . . . . . . . . . . . . . . . . . . . . . . . . . . . . . . . . . . . . 4,687 4,491 196 4.4%
International direct minutes . . . . . . . . . . . . . . . . . . . . . . . . . . . . . . . . . . . . . . 528 534 (6) (1.1%)
ISDN access (basic lines equivalents) (in thousands). . . . . . . . . . . . . . . . . . . . . . . . 1,172 1,214 (42) (3.5%)
Billable traffic data (in millions)
Inbound calling products - B party minutes . . . . . . . . . . . . . . . . . . . . . . . . . . . . . 2,635 2,922 (287) (9.8%)
Inbound calling products - A party calls . . . . . . . . . . . . . . . . . . . . . . . . . . . . . . . 1,008 1,012 (4) (0.4%)
Mobile services statistical data
Mobile services in operation (SIO) (in thousands)
3GSM . . . . . . . . . . . . . . . . . . . . . . . . . . . . . . . . . . . . . . . . . . . . . . . . . . . . . 2,003 317 1,686 531.9%
2GSM . . . . . . . . . . . . . . . . . . . . . . . . . . . . . . . . . . . . . . . . . . . . . . . . . . . . . 5,947 6,468 (521) (8.1%)
CDMA. . . . . . . . . . . . . . . . . . . . . . . . . . . . . . . . . . . . . . . . . . . . . . . . . . . . . 1,262 1,744 (482) (27.6%)
Mobile services in operation (in thousands) . . . . . . . . . . . . . . . . . . . . . . . . . . . . 9,212 8,529 683 8.0%
Total wholesale mobile SIOs (in thousands) . . . . . . . . . . . . . . . . . . . . . . . . . . . . 131 119 12 10.1%
Billable traffic data (in millions)
Mobile voice telephone minutes . . . . . . . . . . . . . . . . . . . . . . . . . . . . . . . . . . . . 8,640 7,361 1,279 17.4%
Number of short messaging service (SMS) sent . . . . . . . . . . . . . . . . . . . . . . . . . . . 4,902 3,019 1,883 62.4%
Internet statistical data
Online subscribers (in thousands)
Broadband subscribers - retail . . . . . . . . . . . . . . . . . . . . . . . . . . . . . . . . . . . . . 2,406 1,506 900 59.8%
Broadband subscribers - wholesale . . . . . . . . . . . . . . . . . . . . . . . . . . . . . . . . . . 1,762 1,427 335 23.5%
Total broadband subscribers . . . . . . . . . . . . . . . . . . . . . . . . . . . . . . . . . . . . . . 4,168 2,933 1,235 42.1%
Narrowband subscribers . . . . . . . . . . . . . . . . . . . . . . . . . . . . . . . . . . . . . . . . . 654 1,027 (373) (36.3%)
Total online subscribers (in thousands) . . . . . . . . . . . . . . . . . . . . . . . . . . . . . . . 4,822 3,960 862 21.8%
Tot a l FOXTEL† subscribers (in thousands). . . . . . . . . . . . . . . . . . . . . . . . . . . . . . 1,265 1,129 136 12.0%
Employee data
Domestic full time staff . . . . . . . . . . . . . . . . . . . . . . . . . . . . . . . . . . . . . . . . . 35,706 37,599 (1,893) (5.0%)
Full time staff and equivalents . . . . . . . . . . . . . . . . . . . . . . . . . . . . . . . . . . . . . 43,411 44,452 (1,041) (2.3%)
Total workforce . . . . . . . . . . . . . . . . . . . . . . . . . . . . . . . . . . . . . . . . . . . . . . 47,840 49,443 (1,603) (3.2%)