TJ Maxx 2000 Annual Report Download - page 11
Download and view the complete annual report
Please find page 11 of the 2000 TJ Maxx annual report below. You can navigate through the pages in the report by either clicking on the pages listed below, or by using the keyword search tool below to find specific information within the annual report.
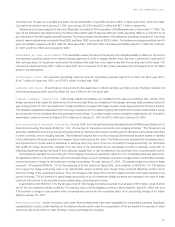
A summary of the status of TJX’s stock options and related Weighted Average Exercise Prices (WAEP), adjusted for historical stock
splits, is presented below (shares in thousands):
Fiscal Year Ended
January 27, 2001 January 29, 2000 January 30, 1999
Shares WAEP Shares WAEP Shares WAEP
Outstanding at beginning of year 11,832 $17.06 10,105 $12.04 10,507 $ 9.04
Granted 5,178 20.75 3,164 29.26 1,964 21.77
Exercised (2,724) 9.85 (1,275) 7.13 (2,215) 6.31
Canceled (249) 24.59 (162) 20.52 (151) 13.35
Outstanding at end of year 14,037 19.69 11,832 17.06 10,105 12.04
Options exercisable at end of year 5,880 $15.98 5,980 $10.77 4,796 $ 8.01
Virtually all canceled options are forfeitures. TJX realizes an income tax benefit from the exercise of stock options which results in a
decrease in current income taxes payable and an increase in additional paid–in capital. Such benefits amounted to $15.9 million, $11.7
million and $13.8 million for the fiscal years ended January 27, 2001, January 29, 2000 and January 30, 1999, respectively.
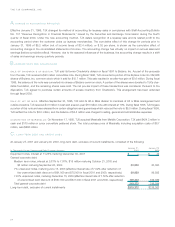
TJX has adopted the disclosure–only provisions of Statement of Financial Accounting Standards (SFAS) No. 123, “Accounting for
Stock–Based Compensation,” and continues to apply the provisions of Accounting Principles Board (APB) Opinion No. 25, “Accounting for
Stock Issued to Employees,” in accounting for compensation expense under its stock option plans. TJX grants options at fair market value
on the date of the grant; accordingly, no compensation expense has been recognized for the stock options issued during fiscal years 2001,
2000 or 1999. Compensation expense determined in accordance with SFAS No. 123, net of related income taxes, would have amounted
to $19.2 million, $12.9 million and $8.7 million for fiscal 2001, fiscal 2000 and fiscal 1999, respectively. Income from continuing operations,
net income and related earnings per share amounts, presented on a pro forma basis, are as follows:
Unaudited Pro Forma Fiscal Year Ended
January 27, January 29, January 30,
Dollars In Thousands Except Per Share Amounts 2001 2000 1999
Income from continuing operations before
cumulative effect of accounting change $518,837 $513,862 $424,512
Per diluted share $ 1.79 $ 1.62 $ 1.27
Net income $518,837 $508,708 $415,464
Per diluted share $ 1.79 $ 1.60 $ 1.24
For purposes of applying the provisions of SFAS No. 123 for the pro forma calculations, the fair value of each option grant issued during
fiscal 2001, 2000 and 1999 is estimated on the date of grant using the Black–Scholes option pricing model with the following assump-
tions: dividend yield of 1% in each fiscal year, expected volatility of 48%, 46% and 40% in fiscal 2001, 2000 and 1999, respectively, a
risk–free interest rate of 5.2% in fiscal 2001, 6.4% in fiscal 2000 and 5.0% in fiscal 1999, and expected holding periods of six years in
all fiscal periods. The weighted average fair value of options granted during fiscal 2001, 2000 and 1999 was $10.07, $14.38 and $9.28
per share, respectively.
The effects of applying SFAS No. 123 in this pro forma disclosure are not indicative of future amounts. SFAS No. 123 does not apply
to awards prior to 1995 and additional awards in future years are anticipated.
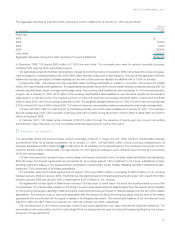
The following table summarizes information about stock options outstanding as of January 27, 2001 (shares in thousands):
Options Outstanding Options Exercisable
Weighted Weighted Weighted
Average Average Average
Range of Remaining Exercise Exercise
Exercise Prices Shares Contract Life Price Shares Price
$ 2.5625 – $ 6.3125 652 3.4 Years $ 4.71 652 $ 4.71
$ 6.3126 – $10.6875 1,661 5.9 Years 9.90 1,661 9.90
$10.6876 – $14.4688 1,973 6.5 Years 13.85 1,473 14.45
$14.4689 – $21.7500 6,729 9.1 Years 20.98 1,065 21.75
$21.7501 – $30.5000 3,022 8.6 Years 29.22 1,029 29.16
Total 14,037 8.0 Years $19.69 5,880 $15.98
THE TJX COMPANIES, INC.
27


