TJ Maxx 2000 Annual Report Download - page 1
Download and view the complete annual report
Please find page 1 of the 2000 TJ Maxx annual report below. You can navigate through the pages in the report by either clicking on the pages listed below, or by using the keyword search tool below to find specific information within the annual report.-
 1
1 -
 2
2 -
 3
3 -
 4
4 -
 5
5 -
 6
6 -
 7
7 -
 8
8 -
 9
9 -
 10
10 -
 11
11 -
 12
12 -
13
-
14
-
15
-
16
-
17
-
18
-
19
-
20
-
21
-
22
-
23
-
24
-
25
-
26
-
27
-
28
-
29
-
30
-
31
-
32
 |
 |

Selected Financial Data (Continuing Operations)
Dollars In Thousands Fiscal Year Ended January
Except Per Share Amounts 2001 2000 1999 1998 1997
(53 weeks)
INCOME STATEMENT AND PER SHARE DATA:
Net sales $9,579,006 $8,795,347 $7,949,101 $7,389,069 $6,689,410
Income from continuing operations
before extraordinary item
and cumulative effect of
accounting change $ 538,066 $ 526,822 $ 433,202 $ 306,592 $ 213,826
Weighted average common
shares for diluted earnings
per share calculation 289,196,228 317,790,764 334,647,950 349,612,184 350,650,100
Diluted earnings per share from
continuing operations before
extraordinary item and cumulative
effect of accounting change $1.86 $1.66 $1.29 $.88 $.61
Cash dividends declared per share $ .16 $ .14 $ .12 $.10 $.07
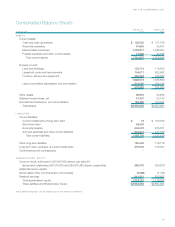
BALANCE SHEET DATA:
Cash and cash equivalents $ 132,535 $ 371,759 $ 461,244 $ 404,369 $ 474,732
Working capital 493,188 513,376 629,247 622,240 588,868
Total assets 2,932,283 2,804,963 2,747,846 2,609,632 2,506,761
Capital expenditures 257,005 238,569 207,742 192,382 119,153
Long-term debt 319,372 319,367 220,344 221,024 244,410
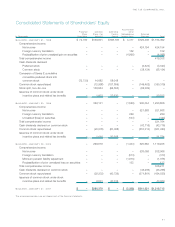
Shareholders’ equity 1,218,712 1,119,228 1,220,656 1,164,092 1,127,186
OTHER FINANCIAL DATA:
After-tax return on average
shareholders’ equity 46.0% 45.0% 36.3% 26.8% 22.6%
Total debt as a percentage
of total capitalization (1) 22.7% 27.3% 15.3% 17.3% 19.4%
STORES IN OPERATION AT YEAR-END:
T.J. Maxx 661 632 604 580 578
Marshalls 535 505 475 461 454
Winners 117 100 87 76 65
T.K. Maxx 74 54 39 31 18
HomeGoods 81 51 35 23 21
A.J. Wright 25 15 6 ––
Total 1,493 1,357 1,246 1,171 1,136
(1) Total capitalization includes shareholders’ equity and short and long-term debt, including current installments.
THE TJX COMPANIES, INC.
17