Suzuki 2004 Annual Report Download - page 47
Download and view the complete annual report
Please find page 47 of the 2004 Suzuki annual report below. You can navigate through the pages in the report by either clicking on the pages listed below, or by using the keyword search tool below to find specific information within the annual report.-
 1
1 -
2
-
3
-
4
-
5
-
6
-
7
-
8
-
9
-
10
-
11
-
12
-
13
-
14
-
15
-
16
-
17
-
18
-
19
-
20
-
21
-
22
-
23
-
24
-
25
-
26
-
27
-
28
-
29
-
30
-
31
-
32
-
33
-
34
-
35
-
36
-
 37
37 -
 38
38 -
 39
39 -
 40
40 -
 41
41 -
 42
42 -
 43
43 -
 44
44 -
 45
45 -
 46
46 -
 47
47 -
 48
48 -
 49
49 -
 50
50 -
 51
51
 |
 |

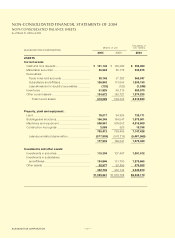
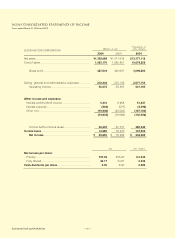
SUZUKI MOTOR CORPORATION
Thousands of
SUZUKI MOTOR CORPORATION
Millions of yen U.S. dollars
2004 2003 2004
ASSETS
Current assets:
Cash and time deposits ............................................. ¥ 101,142 ¥ 102,390 $ 956,969
Marketable securities ................................................ 56,524 55,178 534,815
Receivables:
Trade notes and accounts ..................................... 38,148 37,292 360,947
Subsidiaries and affiliates ...................................... 126,843 113,656 1,200,150
Less allowance for doubtful receivables ................ (132) (132) (1,248)
Inventories ................................................................. 61,825 90,215 584,970
Other current assets .................................................. 134,672 140,721 1,274,225
Total current assets 519,025 539,322 4,910,830
Property, plant and equipment:
Land ........................................................................... 78,017 94,926 738,171
Buildings and structures ............................................ 166,345 164,547 1,573,901
Machinery and equipment ......................................... 508,961 509,052 4,815,609
Construction in progress ........................................... 2,088 929 19,756
755,412 769,456 7,147,438
Less accumulated depreciation ............................. (577,909) (570,215) (5,467,969)
177,503 199,241 1,679,469
Investments and other assets:
Investments in securities ........................................... 115,309 107,497 1,091,012
Investments in subsidiaries
and affiliates ........................................................... 134,846 131,750 1,275,865
Other assets .............................................................. 92,577 92,896 875,932
342,732 332,144 3,242,810
¥1,039,261 ¥1,070,708 $9,833,110
NON-CONSOLIDATED FINANCIAL STATEMENTS OF 2004
NON-CONSOLIDATED BALANCE SHEETS
As of March 31, 2004 and 2003
47