Suzuki 2004 Annual Report Download - page 40
Download and view the complete annual report
Please find page 40 of the 2004 Suzuki annual report below. You can navigate through the pages in the report by either clicking on the pages listed below, or by using the keyword search tool below to find specific information within the annual report.-
 1
1 -
2
-
3
-
4
-
5
-
6
-
7
-
8
-
9
-
10
-
11
-
12
-
13
-
14
-
15
-
16
-
17
-
18
-
19
-
20
-
21
-
22
-
23
-
24
-
25
-
26
-
27
-
28
-
29
-
 30
30 -
 31
31 -
 32
32 -
 33
33 -
 34
34 -
 35
35 -
 36
36 -
 37
37 -
 38
38 -
 39
39 -
 40
40 -
 41
41 -
 42
42 -
 43
43 -
 44
44 -
 45
45 -
 46
46 -
 47
47 -
 48
48 -
 49
49 -
 50
50 -
51
 |
 |

SUZUKI MOTOR CORPORATION
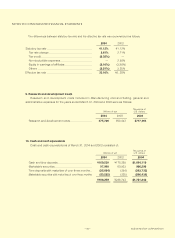
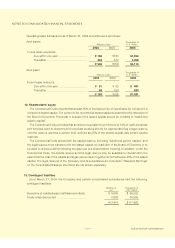
The differences between statutory tax rate and the effective tax rate were summarized as follows:
2004 2003
Statutory tax rate ........................................................... 41.12% 41.12%
Tax rate change ........................................................ 2.61% 2.71%
Tax credit .................................................................. (6.32%) —
Non-deductible expenses......................................... — 2.58%
Equity in earnings of affiliates ................................... (2.10%) (3.38%)
Others ....................................................................... (2.21%) 3.25%
Effective tax rate ........................................................... 33.10% 46..28%
Thousands of
Millions of yen U.S. dollars
2004 2003 2004
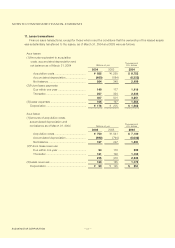
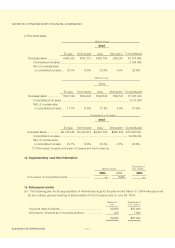
Research and development costs ............................ ¥75,786 ¥60,443 $717,063
9. Research and development Costs
Research and development costs included in Manufacturing cost and Selling, general and
administrative expenses for the years ended March 31, 2004 and 2003 were as follows:
Thousands of
Millions of yen U.S. dollars
2004 2003 2004
Cash and time deposits ............................................ ¥169,539 ¥178,289 $1,604,119
Marketable securities ................................................ 97,900 60,933 926,295
Time deposits with maturities of over three months.. (25,654) (254) (242,733)
Marketable securities with maturities of over three months
(53,525) (225) (506,434)
¥188,259 ¥238,743 $1,781,246
10. Cash and cash equivalents
Cash and cash equivalents as of March 31, 2004 and 2003 consisted of:
40
NOTES TO CONSOLIDATED FINANCIAL STATEMENTS