Suzuki 2004 Annual Report Download - page 44
Download and view the complete annual report
Please find page 44 of the 2004 Suzuki annual report below. You can navigate through the pages in the report by either clicking on the pages listed below, or by using the keyword search tool below to find specific information within the annual report.-
 1
1 -
2
-
3
-
4
-
5
-
6
-
7
-
8
-
9
-
10
-
11
-
12
-
13
-
14
-
15
-
16
-
17
-
18
-
19
-
20
-
21
-
22
-
23
-
24
-
25
-
26
-
27
-
28
-
29
-
30
-
31
-
32
-
33
-
 34
34 -
 35
35 -
 36
36 -
 37
37 -
 38
38 -
 39
39 -
 40
40 -
 41
41 -
 42
42 -
 43
43 -
 44
44 -
 45
45 -
 46
46 -
 47
47 -
 48
48 -
 49
49 -
 50
50 -
 51
51
 |
 |

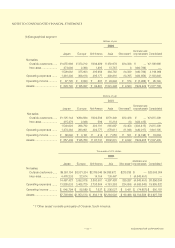
SUZUKI MOTOR CORPORATION
Millions of yen
2004
Elimination and
Japan Europe
North America
Asia
Other areas*1
corporate assets
Consolidated
Net sales:
Outside customers ......
¥1,055,969 ¥ 373,212 ¥294,489 ¥ 450,976 ¥24,338 ¥ — ¥2,198,986
Inter-area.....................
473,093 2,390 1,495 13,787 0 (490,766) —
1,529,062 375,603 295,984 464,763 24,339 (490,766) 2,198,986
Operating expenses .......
1,461,336 366,610 295,177 439,816 23,765 (482,859) 2,103,846
Operating income ...........
¥ 67,725 ¥ 8,993 ¥ 807 ¥ 24,946 ¥ 574 ¥ (7,906) ¥ 95,140
Assets .............................
¥ 823,745 ¥ 195,897 ¥ 84,881 ¥ 241,398 ¥ 9,563 ¥222,222 ¥1,577,709
Net sales:
Outside customers ......
¥1,125,144 ¥294,694 ¥302,594 ¥270,449 ¥22,426 ¥ — ¥2,015,309
Inter-area.....................
415,479 2,098 596 15,218 23 (433,415) —
1,540,623 296,792 303,191 285,667 22,450
(433,415)
2,015,309
Operating expenses .......
1,474,383 293,601 302,777 278,611 21,948 (430,217) 1,941,105
Operating income ...........
¥ 66,240 ¥ 3,191 ¥ 414 ¥ 7,055 ¥ 501 ¥ (3,198) ¥ 74,204
Assets .............................
¥ 857,439 ¥145,780 ¥ 67,731 ¥232,231 ¥ 9,942 ¥224,305 ¥1,537,430
Net sales:
Outside customers ......
$9,991,194 $3,531,204 $2,786,346 $4,266,972 $230,286 $ — $20,806,004
Inter-area.....................
4,476,233 22,614 14,154 130,447 1 (4,643,451) —
............................................
14,467,427 3,553,818 2,800,501 4,397,420 230,287 (4,643,451) 20,806,004
Operating expenses .......
13,826,633 3,468,729 2,792,864 4,161,383 224,856 (4,568,643) 19,905,822
Operating income ...........
$ 640,794 $ 85,089 $ 7,637 $ 236,037 $ 5,431 $ (74,807) $ 900,181
Assets .............................
$7,793,980 $1,853,513 $ 803,116 $2,284,022 $ 90,488 $2,102,588 $14,927,709
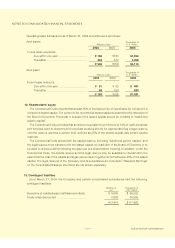
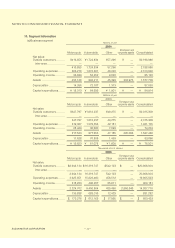
(b)Geographical segment
Thousands of U.S. dollars
2004
Elimination and
Japan Europe
North America
Asia Other areas*1
corporate assets
Consolidated
*1 "Other areas" consists principally of Oceania, South America.
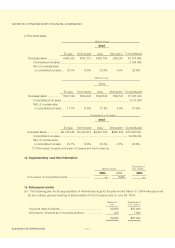
NOTES TO CONSOLIDATED FINANCIAL STATEMENTS
Millions of yen
2003
Elimination and
Japan Europe
North America
Asia
Other areas*1
corporate assets
Consolidated
44