Suzuki 2004 Annual Report Download - page 19
Download and view the complete annual report
Please find page 19 of the 2004 Suzuki annual report below. You can navigate through the pages in the report by either clicking on the pages listed below, or by using the keyword search tool below to find specific information within the annual report.-
 1
1 -
2
-
3
-
4
-
5
-
6
-
7
-
8
-
 9
9 -
 10
10 -
 11
11 -
 12
12 -
 13
13 -
 14
14 -
 15
15 -
 16
16 -
 17
17 -
 18
18 -
 19
19 -
 20
20 -
 21
21 -
 22
22 -
 23
23 -
 24
24 -
 25
25 -
 26
26 -
 27
27 -
 28
28 -
 29
29 -
30
-
31
-
32
-
33
-
34
-
35
-
36
-
37
-
38
-
39
-
40
-
41
-
42
-
43
-
44
-
45
-
46
-
47
-
48
-
49
-
50
-
51
 |
 |

SUZUKI MOTOR CORPORATION
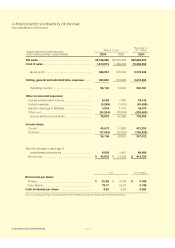
(2) Selling, general and administrative expenses
The Suzuki group has made positive efforts to widen our scope of technical development moving beyond the
areas of current expertise. By offering competitive and original products which are in line with developments in
technical innovation, we are striving to meet the more diversified needs of users under stringent market
conditions. As a result, our R&D expenses increased by 20,719 million yen to 74,915 million yen.
(3) Other income and expenses
In the previous fiscal year, the net amount of other income and expenses was a loss of 11,935 million yen due
to control premium, retirement benefit and the valuation loss of marketable securities, in spite of the return of the
substitute component of pension assets, interest and dividend incomes and equity in earnings of affiliates. For
this fiscal year, we adopted "Accounting Standards of Impairment for Fixed Assets" and impairment loss of
17,419 million yen was posted.
The net amount of other income and expenses was a loss of 16,268 million yen due to this impairment of fixed
assets and a rise in expenses at our newly consolidated subsidiaries.
As a result, the net loss of other income and expenses increased by 4,332 million yen in comparison with the
previous fiscal year.
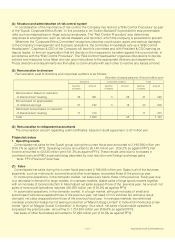
(4) The operating results of geographical segmentation
(In Japan)
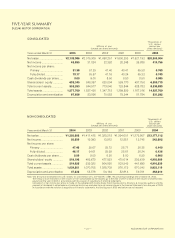
Net sales amounted to 1,529,062 million yen (99.2% as against PFY) and operating income increased to
67,725 million yen (102.2% as against PFY) absorbing the increase of overhead costs etc. and R&D expenses
by cost reduction etc.
(In Europe)
Net sales amounted to 375,603 million yen (126.6% as against PFY) and operating income increased to 8,993
million yen (281.8% as against PFY) by the increase of net sales and cost reduction etc.
(In North America)
Net sales amounted to 295,984 million yen (97.6% as against PFY) and operating income increased to 807
million yen (194.9% as against PFY) by the decrease of sales expenses etc.
(In Asia)
For the reason that P.T. Indomobil Suzuki International became one of consolidated subsidiaries and net sales
of overseas manufacturing companies increased, net sales amounted to 464,763 million yen (162.7% as
against PFY) and operating income to 24,946 million yen (353.6% as against PFY), enjoying the sharp
increase of both revenue and income.
(In other areas)
Net sales amounted to 24,339 million yen (108.4% as against PFY) and operating income to 574 million yen
(114.6% as against PFY) by cost reduction etc.
(5) Outlook of results in the next fiscal year
As for the forthcoming business environments, it is anticipated that unpredictable and severe situation will last
for both domestic and overseas market but the Suzuki group will work all together for innovation in every area,
getting engaged in evolution of business activities to achieve 2,200,000 million yen in net sales and 60,000
million yen in net income.
The above is based on the anticipated foreign exchange rate of 1 US dollar = 105 yen and
1 Euro = 125 yen.
The outlook of business results, estimated based on the current information available and assumption,
includes risk and uncertainty. It is requested, therefore, to understand that the actual results may extensively
vary by the change of many factors. Those factors, which may influence the actual results, include economic
conditions and the trend of demand in major markets and the fluctuation of foreign exchange rate (mainly Yen/
US dollar rate, Yen/Euro rate).
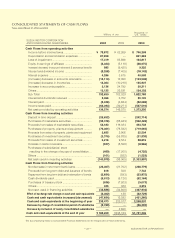
2. Liquidity and capital resources
(1) Situation of cash flow
The net cash provided by operating activities decreased to 134,574 million yen, which is 11,501 million yen
less than the previous fiscal year, mainly due to increases in income tax paid.
19