Sunoco 2014 Annual Report Download - page 9
Download and view the complete annual report
Please find page 9 of the 2014 Sunoco annual report below. You can navigate through the pages in the report by either clicking on the pages listed below, or by using the keyword search tool below to find specific information within the annual report.-
 1
1 -
 2
2 -
 3
3 -
 4
4 -
 5
5 -
 6
6 -
 7
7 -
 8
8 -
 9
9 -
 10
10 -
 11
11 -
 12
12 -
 13
13 -
 14
14 -
 15
15 -
 16
16 -
 17
17 -
 18
18 -
 19
19 -
 20
20 -
21
-
22
-
23
-
24
-
25
-
26
-
27
-
28
-
29
-
30
-
31
-
32
-
33
-
34
-
35
-
36
-
37
-
38
-
39
-
40
-
41
-
42
-
43
-
44
-
45
-
46
-
47
-
48
-
49
-
50
-
51
-
52
-
53
-
54
-
55
-
56
-
57
-
58
-
59
-
60
-
61
-
62
-
63
-
64
-
65
-
66
-
67
-
68
-
69
-
70
-
71
-
72
-
73
-
74
-
75
-
76
-
77
-
78
-
79
-
80
-
81
-
82
-
83
-
84
-
85
-
86
-
87
-
88
-
89
-
90
-
91
-
92
-
93
-
94
-
95
-
96
-
97
-
98
-
99
-
100
-
101
-
102
-
103
-
104
-
105
-
106
-
107
-
108
-
109
-
110
-
111
-
112
-
113
-
114
-
115
-
116
-
117
-
118
-
119
-
120
-
121
-
122
-
123
-
124
-
125
-
126
-
127
-
128
-
129
-
130
-
131
-
132
-
133
-
134
-
135
-
136
-
137
-
138
-
139
-
140
-
141
-
142
-
143
-
144
-
145
-
146
-
147
-
148
-
149
-
150
-
151
-
152
-
153
-
154
-
155
-
156
-
157
-
158
-
159
-
160
-
161
-
162
-
163
-
164
-
165
 |
 |

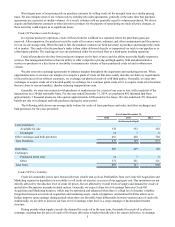
7
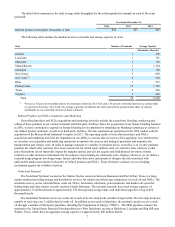
The table below summarizes the total average daily throughput for the refined products terminals in each of the years
presented:
Year Ended December 31,
2014 2013 2012
Refined products throughput (thousands of bpd) 414 431 487
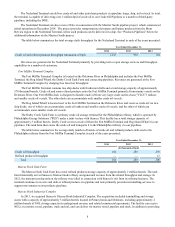
The following table outlines the number of active terminals and storage capacity by state:
State Number of Terminals Storage Capacity
(thousands of barrels)
Indiana 1 206
Louisiana 1 161
Maryland 1 710
Massachusetts 1 1,144
Michigan 3 760
New Jersey 3 650
New York (1) 4 920
Ohio 7 957
Pennsylvania 13 1,743
Texas 4 548
Virginia 1 403
Total 39 8,202
(1) We have a 45 percent ownership interest in a terminal at Inwood, New York and a 50 percent ownership interest in a terminal that
we operate in Syracuse, New York. The storage capacities included in the table represent the proportionate share of capacity
attributable to our ownership interests in these terminals.
Refined Products and NGLs Acquisition and Marketing
Our refined products and NGLs acquisition and marketing activities include the acquisition, blending, marketing and
selling of these products at our various terminals and third-party facilities. Since the acquisition of our butane blending business
in 2010, we have continued to expand our butane blending service platform by installing our blending technology at certain of
our refined product terminals, as well as at third-party facilities. We also expanded our operations in the NGL market with the
acquisition of the Marcus Hook Industrial Complex in 2013. The operating results of our refined products and NGLs
acquisition and marketing activities are dependent on our ability to execute sales in excess of the aggregate cost, and therefore
we structure our acquisition and marketing operations to optimize the sources and timing of purchases and minimize the
transportation and storage costs. In order to manage exposure to volatility in products prices, our policy is to (i) only purchase
products for which sales contracts have been executed or for which ready markets exist, (ii) structure sales contracts so that
price fluctuations do not materially impact the margins earned, and (iii) not acquire and hold physical inventory, futures
contracts or other derivative instruments for the purpose of speculating on commodity price changes. However, we do utilize a
seasonal hedge program involving swaps, futures and other derivative instruments to mitigate the risk associated with
unfavorable market movements in the price of refined products and NGLs. These derivative contracts act as a hedging
mechanism against the volatility of prices.
Nederland Terminal
The Nederland Terminal, located on the Sabine-Neches waterway between Beaumont and Port Arthur, Texas, is a large
marine terminal providing storage and distribution services for refiners and other large transporters of crude oil and NGLs. The
terminal receives, stores, and distributes crude oil, NGLs, feedstocks, lubricants, petrochemicals, and bunker oils (used for
fueling ships and other marine vessels), and also blends lubricants. The terminal currently has a total storage capacity of
approximately 25 million barrels in approximately 130 aboveground storage tanks with individual capacities of up to 660
thousand barrels.
The Nederland Terminal can receive crude oil at each of its five ship docks and three barge berths. The five ship docks are
capable of receiving over 2 million bpd of crude oil. In addition to our crude oil pipelines, the terminal can also receive crude
oil through a number of third-party pipelines, including the Department of Energy (“DOE”). The DOE pipelines connect the
terminal to the United States Strategic Petroleum Reserve's West Hackberry caverns at Hackberry, Louisiana and Big Hill near
Winnie, Texas, which have an aggregate storage capacity of approximately 400 million barrels.