Sunoco 2014 Annual Report Download - page 12
Download and view the complete annual report
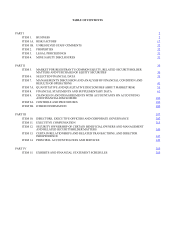
Please find page 12 of the 2014 Sunoco annual report below. You can navigate through the pages in the report by either clicking on the pages listed below, or by using the keyword search tool below to find specific information within the annual report.-
 1
1 -
 2
2 -
 3
3 -
 4
4 -
 5
5 -
 6
6 -
 7
7 -
 8
8 -
 9
9 -
 10
10 -
 11
11 -
 12
12 -
 13
13 -
 14
14 -
 15
15 -
 16
16 -
 17
17 -
 18
18 -
 19
19 -
 20
20 -
 21
21 -
 22
22 -
23
-
24
-
25
-
26
-
27
-
28
-
29
-
30
-
31
-
32
-
33
-
34
-
35
-
36
-
37
-
38
-
39
-
40
-
41
-
42
-
43
-
44
-
45
-
46
-
47
-
48
-
49
-
50
-
51
-
52
-
53
-
54
-
55
-
56
-
57
-
58
-
59
-
60
-
61
-
62
-
63
-
64
-
65
-
66
-
67
-
68
-
69
-
70
-
71
-
72
-
73
-
74
-
75
-
76
-
77
-
78
-
79
-
80
-
81
-
82
-
83
-
84
-
85
-
86
-
87
-
88
-
89
-
90
-
91
-
92
-
93
-
94
-
95
-
96
-
97
-
98
-
99
-
100
-
101
-
102
-
103
-
104
-
105
-
106
-
107
-
108
-
109
-
110
-
111
-
112
-
113
-
114
-
115
-
116
-
117
-
118
-
119
-
120
-
121
-
122
-
123
-
124
-
125
-
126
-
127
-
128
-
129
-
130
-
131
-
132
-
133
-
134
-
135
-
136
-
137
-
138
-
139
-
140
-
141
-
142
-
143
-
144
-
145
-
146
-
147
-
148
-
149
-
150
-
151
-
152
-
153
-
154
-
155
-
156
-
157
-
158
-
159
-
160
-
161
-
162
-
163
-
164
-
165
 |
 |

10
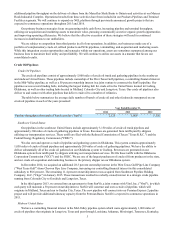
and Utica Shale areas of Western Pennsylvania, Mariner East 2 will also deliver NGLs from the shale areas in West Virginia
and Eastern Ohio. Mariner East 2 is expected to commence operations in the fourth quarter 2016.
The Mariner South pipeline provides transportation of propane and butane products from the Mont Belvieu region to the
Nederland Terminal. Mariner South commenced initial operations in December 2014, with an initial capacity to transport
approximately 200,000 barrels per day of natural gas liquids and other products.
Since December 31, 2010, we completed the following acquisitions related to our products pipelines:
• Explorer Pipeline—In March 2014, we exercised rights to acquire an additional ownership in Explorer Pipeline
Company ("Explorer") for $42 million, increasing the Partnership's ownership interest from 9.4 to 13.3 percent.
Explorer owns approximately 1,850 miles of refined products pipelines running from the Gulf Coast of the United
States to the Chicago, Illinois area.
• Inland Corporation—In May 2011, we acquired an 83.8 percent equity interest in Inland from Sunoco and Shell Oil
Company. Inland is the owner of approximately 350 miles of active refined products pipelines in Ohio. The pipeline
connects three refineries in Ohio to terminals and major markets within the state. As we have a controlling financial
interest in Inland, the joint venture is reflected as a consolidated subsidiary in our consolidated financial statements.
We assumed operatorship of the pipeline during 2012.
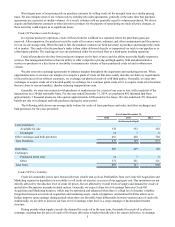
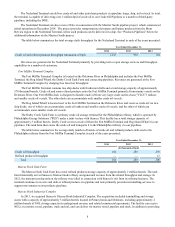
The following table shows the average shipments on the products pipelines in each of the years presented. Average
shipments represent the average revenue-generating pipeline throughput:
Year Ended December 31,
2014 2013 2012
Pipeline throughput (thousands of bpd)(1) 552 571 582
(1) Excludes amounts attributable to equity ownership interests in corporate joint ventures which are not consolidated.
The mix of products delivered varies seasonally, with gasoline demand peaking during the summer months, and demand
for heating oil and other distillate fuels peaking in the winter. In addition, weather conditions in the areas served by the
Products Pipelines affect both the demand for, and the mix of, the products delivered through the pipelines, although
historically, any overall impact on the total volume shipped has been short-term.
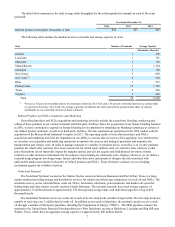
Joint Ventures
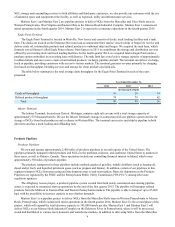
We own equity interests in several common carrier products pipelines, summarized in the following table:
Pipeline SXL Equity Ownership Approximate Pipeline Mileage
Explorer Pipeline Company (1) 13.3% 1,850
Yellowstone Pipe Line Company (2) 14.0% 700
West Shore Pipe Line Company (3) 17.1% 650
Wolverine Pipe Line Company (4) 31.5% 700
(1) The system, which is operated by Explorer employees, originates from the refining centers of Beaumont, Port Arthur and Houston,
Texas, and extends to Chicago, Illinois, with delivery points in the Houston, Dallas/Fort Worth, Tulsa, St. Louis, and Chicago areas.
Explorer charges market-based rates for all its tariffs. An additional 3.9 percent ownership interest was purchased in the first quarter
2014.
(2) The system, which is operated by Phillips 66, originates from the Billings, Montana refining center and extends to Moses Lake,
Washington, with delivery points along the way. Tariff rates are regulated by the FERC for interstate shipments and the Montana
Public Service Commission for intrastate shipments in Montana.
(3) The system, which is operated by Buckeye, originates from the Chicago, Illinois refining center and extends to Madison and Green
Bay, Wisconsin, with delivery points along the way. West Shore charges market-based tariff rates in the Chicago area.
(4) The system, which is operated by Wolverine employees, originates from Chicago, Illinois and extends to Detroit, Grand Haven and
Bay City, Michigan, with delivery points along the way. Wolverine charges market-based rates for tariffs at the Detroit, Jackson,
Niles, Hammond and Lockport destinations.