Snapple 2010 Annual Report Download - page 2
Download and view the complete annual report
Please find page 2 of the 2010 Snapple annual report below. You can navigate through the pages in the report by either clicking on the pages listed below, or by using the keyword search tool below to find specific information within the annual report.-
 1
1 -
 2
2 -
 3
3 -
 4
4 -
 5
5 -
 6
6 -
 7
7 -
 8
8 -
 9
9 -
 10
10 -
 11
11 -
 12
12 -
 13
13 -
14
-
15
-
16
-
17
-
18
-
19
-
20
-
21
-
22
-
23
-
24
-
25
-
26
-
27
-
28
-
29
-
30
-
31
-
32
-
33
-
34
-
35
-
36
-
37
-
38
-
39
-
40
-
41
-
42
-
43
-
44
-
45
-
46
-
47
-
48
-
49
-
50
-
51
-
52
-
53
-
54
-
55
-
56
-
57
-
58
-
59
-
60
-
61
-
62
-
63
-
64
-
65
-
66
-
67
-
68
-
69
-
70
-
71
-
72
-
73
-
74
-
75
-
76
-
77
-
78
-
79
-
80
-
81
-
82
-
83
-
84
-
85
-
86
-
87
-
88
-
89
-
90
-
91
-
92
-
93
-
94
-
95
-
96
-
97
-
98
-
99
-
100
-
101
-
102
-
103
-
104
-
105
-
106
-
107
-
108
-
109
-
110
-
111
-
112
-
113
-
114
-
115
-
116
-
117
-
118
-
119
-
120
-
121
-
122
-
123
-
124
-
125
-
126
-
127
-
128
-
129
-
130
-
131
-
132
-
133
-
134
-
135
-
136
-
137
-
138
-
139
-
140
-
141
-
142
-
143
-
144
-
145
-
146
-
147
-
148
 |
 |

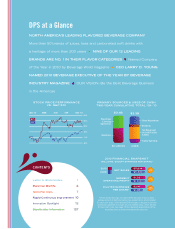
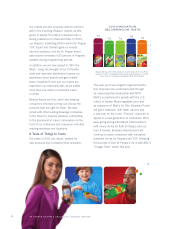
NET SALES
SEGMENT
OPERATING PROFIT
DILUTED EARNINGS
PER SHARE*
*2010 diluted earnings per share (EPS) excludes a loss on early
extinguishment of debt and certain tax-related items, which totaled
23 cents per share. 2009 diluted EPS excludes a net gain on certain
distribution agreement changes and tax-related items, which totaled
20 cents per share. See page 13 for a detailed reconciliation of the
excluded items and the rationale for the exclusion.
2010
2009
2010 FINANCIAL SNAPSHOT
(MILLIONS, EXCEPT EARNINGS PER SHARE)
+2%
+1%
+22%
$5,636
$ 1, 3 2 1
$2.40
$ 5,5 31
$ 1, 3 10
$1.9 7
STOCK PRICE PERFORMANCE
VS. S&P 500
S&P
DPS
40%
30%
20%
10%
0%
-10 %
JAN ’10 MAR JUN SEP DEC ’10
PRIMARY SOURCES & USES OF CASH
TWO-YEAR CUMULATIVE TOTAL ’09–’10
SOURCES
$3.4B
USES
$3.3B
Pepsi/Coke
Licensing
Agreements
Operations
Net Repayment
of Credit Facility
& Notes
Dividends
Share Repurchases
Capital Spending
CONTENTS
Letter to Stockholders 1
Build Our Brands 4
Grow Per Caps 7
Rapid Continuous Improvement 10
Innovation Spotlight 12
Stockholder Information 12 7
DPS at a Glance
NORTH AMERICA’S LEADING FLAVORED BEVERAGE COMPANY
More than 50 brands of juices, teas and carbonated soft drinks with
a heritage of more than 200 years NINE OF OUR 12 LEADING
BRANDS ARE NO. 1 IN THEIR FLAVOR CATEGORIES Named Company
of the Year in 2010 by Beverage World magazine CEO LARRY D. YOUNG
NAMED 2010 BEVERAGE EXECUTIVE OF THE YEAR BY BEVERAGE
INDUSTRY MAGAZINE OUR VISION: Be the Best Beverage Business
in the Americas