Snapple 2010 Annual Report Download - page 11
Download and view the complete annual report
Please find page 11 of the 2010 Snapple annual report below. You can navigate through the pages in the report by either clicking on the pages listed below, or by using the keyword search tool below to find specific information within the annual report.-
 1
1 -
 2
2 -
 3
3 -
 4
4 -
 5
5 -
 6
6 -
 7
7 -
 8
8 -
 9
9 -
 10
10 -
 11
11 -
 12
12 -
 13
13 -
 14
14 -
 15
15 -
 16
16 -
 17
17 -
 18
18 -
 19
19 -
 20
20 -
 21
21 -
 22
22 -
23
-
24
-
25
-
26
-
27
-
28
-
29
-
30
-
31
-
32
-
33
-
34
-
35
-
36
-
37
-
38
-
39
-
40
-
41
-
42
-
43
-
44
-
45
-
46
-
47
-
48
-
49
-
50
-
51
-
52
-
53
-
54
-
55
-
56
-
57
-
58
-
59
-
60
-
61
-
62
-
63
-
64
-
65
-
66
-
67
-
68
-
69
-
70
-
71
-
72
-
73
-
74
-
75
-
76
-
77
-
78
-
79
-
80
-
81
-
82
-
83
-
84
-
85
-
86
-
87
-
88
-
89
-
90
-
91
-
92
-
93
-
94
-
95
-
96
-
97
-
98
-
99
-
100
-
101
-
102
-
103
-
104
-
105
-
106
-
107
-
108
-
109
-
110
-
111
-
112
-
113
-
114
-
115
-
116
-
117
-
118
-
119
-
120
-
121
-
122
-
123
-
124
-
125
-
126
-
127
-
128
-
129
-
130
-
131
-
132
-
133
-
134
-
135
-
136
-
137
-
138
-
139
-
140
-
141
-
142
-
143
-
144
-
145
-
146
-
147
-
148
 |
 |

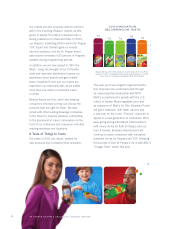
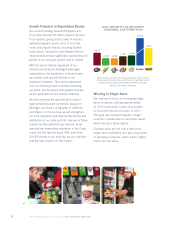
DPS brands increased per-capita consumption in 2010,
making early strides on a 10
–
15 year growth
journey to expand beyond their regional heartlands.
Source: Company-reported 288-oz. bottler case sales
+1.4
SERVINGS
+0.8
SERVINGS
+0.5
SERVINGS
+0.2
SERVINGS
+1. 2
SERVINGS
®
+0.6
SERVINGS
2010 PER-CAPITA GROWTH
(8-oz. servings per-capita per year in the United States)
ALL
OTHER
CUMULATIVE GROWTH IN DPS FO UNTAIN
INSTALLATIONS SINCE 2006
Fountain installations have accelerated in recent years, and brands beyond
Dr Pepper gained momentum starting in 2009. This has provided new sampling
occasions to consumers with each incremental placement.
20102008 2009
20072006
31K
58K
84K
13 6 K
179K
9
GROW PER CAPS
Today, regular Dr Pepper is in half of the 600,000
commercial outlets that sell fountain drinks in the
U.S., and Diet Dr Pepper is in nearly 20 percent.
In those outlets, Dr Pepper is ordered more than
any other flavored CSD.
The brand is already making great strides to
take advantage of the potential in fountain.
Dr Pepper is now served in 100 percent
of Jack in the Box®
, Arby’s®
, Chick-fil-A®
and Whataburger® locations in the United States,
and in many other national chains. DPS also
recently signed an agreement with Popeyes® that
will bring Dr Pepper to an additional 700
locations and Hawaiian Punch to more than
1,300 locations.
We’re also thinking beyond availability to actually
bring consumers out to the stores. Our brands
and promotions deliver value that goes beyond
great taste, and consumers are taking notice.
The partnership between Dr Pepper and
Electronic Arts, Inc., for example, has
increased brand interaction with 18-to-25-
year olds by providing exclusive gaming
content via 20-oz. bottles and fountain cups,
driving traffic to our retailers and increasing
frequency of purchase.