Shutterfly 2011 Annual Report Download - page 39
Download and view the complete annual report
Please find page 39 of the 2011 Shutterfly annual report below. You can navigate through the pages in the report by either clicking on the pages listed below, or by using the keyword search tool below to find specific information within the annual report.-
 1
1 -
2
-
3
-
4
-
5
-
6
-
7
-
8
-
9
-
10
-
11
-
12
-
13
-
14
-
15
-
16
-
17
-
18
-
19
-
20
-
21
-
22
-
23
-
24
-
25
-
26
-
27
-
28
-
 29
29 -
 30
30 -
 31
31 -
 32
32 -
 33
33 -
 34
34 -
 35
35 -
 36
36 -
 37
37 -
 38
38 -
 39
39 -
 40
40 -
 41
41 -
 42
42 -
 43
43 -
 44
44 -
 45
45 -
 46
46 -
 47
47 -
 48
48 -
 49
49 -
50
-
51
-
52
-
53
-
54
-
55
-
56
-
57
-
58
-
59
-
60
-
61
-
62
-
63
-
64
-
65
-
66
-
67
-
68
-
69
-
70
-
71
-
72
-
73
-
74
-
75
-
76
-
77
-
78
-
79
-
80
-
81
-
82
-
83
-
84
-
85
-
86
-
87
-
88
-
89
-
90
-
91
-
92
-
93
-
94
-
95
-
96
-
97
-
98
-
99
-
100
-
101
-
102
-
103
-
104
-
105
-
106
-
107
-
108
-
109
-
110
-
111
-
112
-
113
-
114
-
115
-
116
-
117
-
118
-
119
-
120
-
121
-
122
-
123
 |
 |
Cost of net revenues increased $15.4 million, or 16%, in 2009 compared to 2008. As a percentage of net revenues, cost of net revenues
remained flat, at 45%, resulting in gross margin percentage remaining flat at 55%. Overall, the increase in cost of net revenues was primarily the
result of the increased volume of shipped products, cost increases from the closure and transition of our Hayward production facility to our new
Phoenix production facility, increased headcount, and higher equipment rental expenses compared to 2008. These costs were partially offset by
favorable improvements from product mix, labor efficiencies from both our Charlotte and Phoenix plants and improvements in material costs.
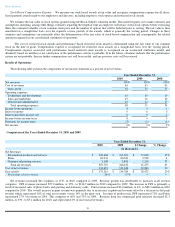
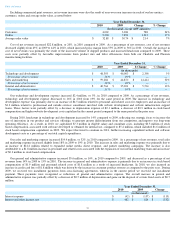
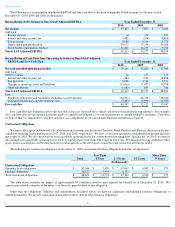
Our technology and development expense increased $6.3 million, or 16%, in 2009 compared to 2008. As a percentage of net revenues,
technology and development expense remained flat at 19% in 2009 and 2008. The increase in technology and development expense was
primarily due to an increase of $2.7 million in third party hosting, power and connectivity costs compared to the prior year. Depreciation
expense increased by $0.5 million as we continued to invest in our website infrastructure hardware to support our continued revenue
growth. Personnel and related costs for employees and consultants involved with website development and website infrastructure support teams
increased by $2.2 million. In 2009, we capitalized $5.4 million in eligible costs, which includes $1.6 million of stock based compensation,
associated with software developed or obtained for internal use, compared to $4.8 million capitalized in 2008.
Our sales and marketing expense increased $2.7 million, or 6%, in 2009 compared to 2008. Also as a percentage of net revenues, total sales
and marketing expense decreased from 20% in 2008 to 18% in 2009. The increase in sales and marketing expense was primarily due to an
increase of $1.6 million in personnel and related costs as we expanded our internal marketing team and an increase of $1.1 million in stock based
compensation. The increase was offset by a decrease of $0.2 million in customer acquisition costs and affiliate fees due to improved
promotional efficiencies and search engine optimization performance.
Our general and administrative expense increased $2.5 million, or 8%, in 2009 compared to 2008, and decreased as a percentage of net
revenues from 15% in 2008 to 14% in 2009. Increase in general and administrative expense is primarily due to an increase in stock based
compensation of $2.4 million, facility costs of $0.8 million, and personnel related costs of $0.4 million. In 2009, we also incurred an increase in
credit card fees of $0.7 million which was driven by our increase in consumer product revenue as compared to the prior year. The overall
increase in general and administrative expense was offset by a decrease of $2.0 million associated with decreases in accounting compliance
efforts and enterprise resource planning (“ERP”)
costs. Also, offsetting general and administrative expenses in 2009, are installment payments
from two cross-
licensing agreements for intellectual property entered into with two different companies. Both agreements require multiple
installments with the second installments received during 2009 from both parties. We expect to recognize the final installment pursuant to one
of the agreements upon receipt in the first quarter of 2010.
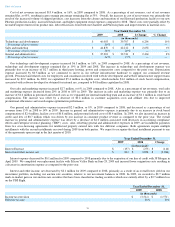
Interest expense decreased by $0.1 million for 2009 compared to 2008 primarily due to the expiration of our line of credit with JP Morgan in
April 2009. We completed our replacement facility with Silicon Valley Bank on June 29, 2009 and incurred lower origination costs resulting in
a decrease in amortization expense as compared to the prior year.
Interest and other income, net decreased by $2.1 million for 2009 compared to 2008, primarily as a result of an overall lower yield on our
investment portfolio, including our auction rate securities, relative to our investment balances in 2008. In 2009, we recorded a $2.7 million
mark-to-market gain on our auction-
rate securities that have been classified as trading securities which was entirely offset by a $2.7 million loss
on the UBS Right.
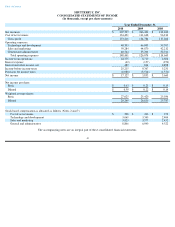
Table of Contents
Year Ended December 31,
2009
2008
$ Change
% Change
(in thousands)
Technology and development
$
46,003
$
39,707
$
6,296
16
%
Percentage of net revenues
19
%
19
%
—
—
Sales and marketing
$
44,870
$
42,212
$
2,658
6
%
Percentage of net revenues
18
%
20
%
—
—
General and administrative
$
35,201
$
32,741
$
2,460
8
%
Percentage of net revenues
14
%
15
%
—
—
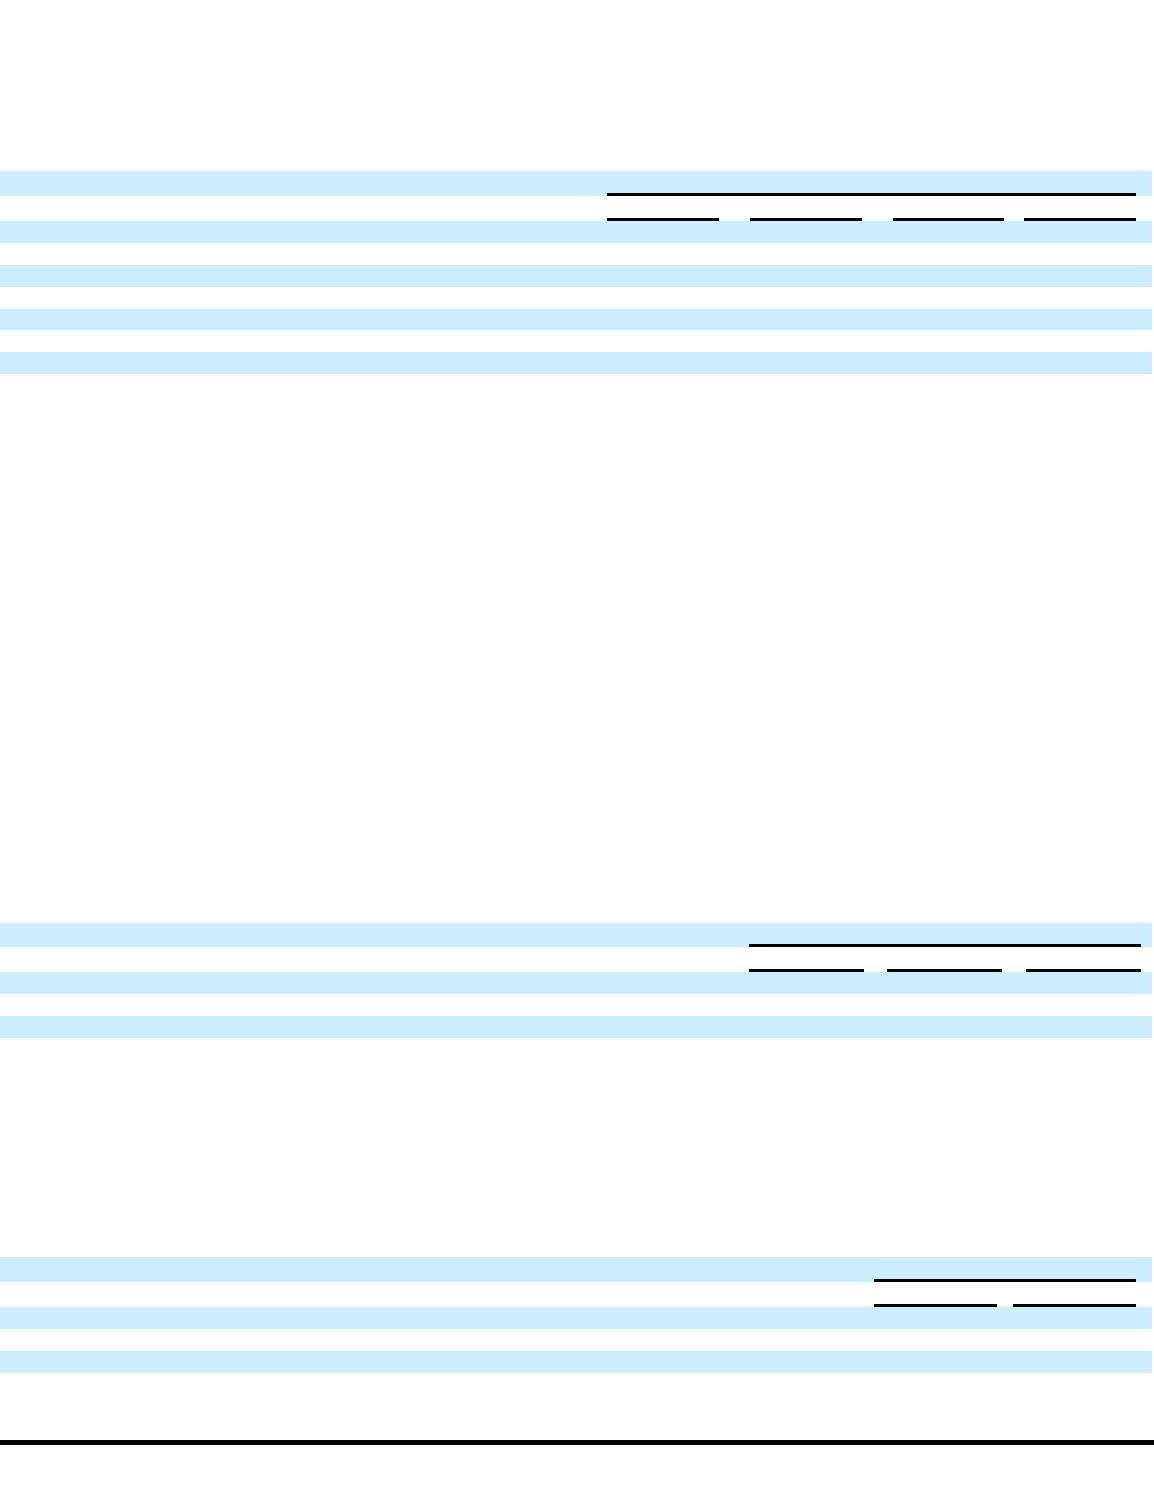
Year Ended December 31,
2009
2008
Change
(in thousands)
Interest Expense
$
(157
)
$
(273
)
$
(116
)
Interest and other income, net
$
814
$
2,898
$
(2,084
)
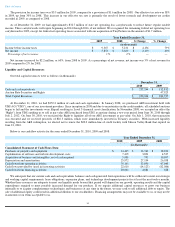
Year Ended December 31,
2009
2008
(in thousands)
Income tax provision
$
(3,514
)
$
(1,571
)
Effective tax rate
38
%
30
%
33