Sallie Mae 2003 Annual Report Download - page 20
Download and view the complete annual report
Please find page 20 of the 2003 Sallie Mae annual report below. You can navigate through the pages in the report by either clicking on the pages listed below, or by using the keyword search tool below to find specific information within the annual report.-
 1
1 -
2
-
3
-
4
-
5
-
6
-
7
-
8
-
9
-
 10
10 -
 11
11 -
 12
12 -
 13
13 -
 14
14 -
 15
15 -
 16
16 -
 17
17 -
 18
18 -
 19
19 -
 20
20 -
 21
21 -
 22
22 -
 23
23 -
 24
24
 |
 |

18
Pro Forma “Core Cash”(1) Consolidated Statements of Income
YEARS ENDED DECEMBER 31,
(Dollars in thousands) 2003 2002 2001
(UNAUDITED) (UNAUDITED) (UNAUDITED)
Managed interest income:
Managed federally insured student loans $2,666,416 $2,864,215 $4,000,347
Managed private credit student loans 426,456 346,237 324,276
Academic facilities financings and other loans 76,740 96,025 125,540
Investments 163,208 87,577 342,979
Total managed interest income 3,332,820 3,394,054 4,793,142
Managed interest expense 1,680,873 2,035,274 3,521,985
Net managed interest income 1,651,947 1,358,780 1,271,157
Less: provision for losses 130,138 130,869 89,145
Net managed interest income after provision for losses 1,521,809 1,227,911 1,182,012
Other income:
Guarantor servicing fees 128,189 106,172 112,160
Debt management fees 258,544 185,881 120,923
Other 257,322 210,739 222,095
Total other income 644,055 502,792 455,178
Operating expenses 780,961 663,487 660,555
Income before income taxes and minority interest in net earnings of subsidiary 1,384,903 1,067,216 976,635
Income taxes 459,021 376,893 342,553
Minority interest in net earnings of subsidiary — — 10,070
“CORE CASH” NET INCOME 925,882 690,323 624,012
Preferred stock dividends 11,501 11,501 11,501
“Core cash” net income attributable to common stock $ 914,381 $ 678,822 $ 612,511
Reconciliation of GAAP Net Income to “Core Cash”(1) Net Income
YEARS ENDED DECEMBER 31,
(Dollars in thousands) 2003 2002 2001
(UNAUDITED) (UNAUDITED) (UNAUDITED)
GAAP NET INCOME $1,533,560 $ 791,996 $ 383,996
“Core cash” adjustments:
Net impact of securitization accounting (306,789) (282,226) (79,987)
Net impact of derivative accounting (502,339) 199,994 460,545
Net impact of floor income (22,897) (92,280) (84,442)
Amortization of acquired intangibles and other 33,959 18,329 63,131
Total “core cash” adjustments before income taxes and
cumulative effect of accounting change (798,066) (156,183) 359,247
Net tax effect(2) 320,359 54,510 (119,231)
Total “core cash” adjustments before cumulative effect of accounting change (477,707) (101,673) 240,016
Cumulative effect of accounting change (129,971) — —
Total “core cash” adjustments (607,678) (101,673) 240,016
“CORE CASH” NET INCOME $ 925,882 $ 690,323 $ 624,012
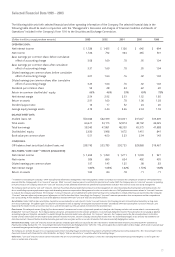
(1) Please see the definition of “core cash” under Selected Financial Data on page 19.
(2) Such tax effect is generally based upon the Company’s marginal tax rate for the respective period. The net tax effect excludes the impact of disallowed losses on equity forward contracts and income
tax expense attributed to the residual interests in the securitized loans.
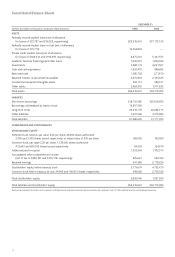
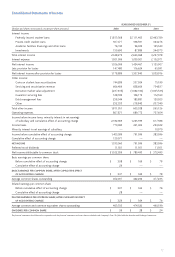
The financial statements should be read in conjunction with the financial statements and notes thereto included in the Company’s Form 10-K filed with the Securities and Exchange Commission.