Sallie Mae 2003 Annual Report Download - page 19
Download and view the complete annual report
Please find page 19 of the 2003 Sallie Mae annual report below. You can navigate through the pages in the report by either clicking on the pages listed below, or by using the keyword search tool below to find specific information within the annual report.-
 1
1 -
2
-
3
-
4
-
5
-
6
-
7
-
8
-
 9
9 -
 10
10 -
 11
11 -
 12
12 -
 13
13 -
 14
14 -
 15
15 -
 16
16 -
 17
17 -
 18
18 -
 19
19 -
 20
20 -
 21
21 -
 22
22 -
 23
23 -
 24
24
 |
 |

17
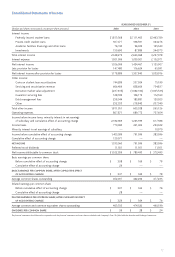
Consolidated Statements of Income
YEARS ENDED DECEMBER 31,
(Dollars and shares in thousands, except per share amounts) 2003 2002 2001
Interest income:
Federally insured student loans $1,813,368 $2,111,463 $2,463,789
Private credit student loans 307,477 338,591 324,276
Academic facilities financings and other loans 76,740 96,025 125,540
Investments 150,690 87,889 344,373
Total interest income 2,348,275 2,633,968 3,257,978
Interest expense 1,021,906 1,209,501 2,132,071
Net interest income 1,326,369 1,424,467 1,125,907
Less: provision for losses 147,480 116,624 65,991
Net interest income after provision for losses 1,178,889 1,307,843 1,059,916
Other income:
Gains on student loan securitizations 744,289 337,924 75,199
Servicing and securitization revenue 666,409 838,609 754,837
Derivative market value adjustment (237,815) (1,082,100) (1,005,533)
Guarantor servicing fees 128,189 106,172 112,160
Debt management fees 258,544 185,881 120,923
Other 252,335 218,842 207,540
Total other income 1,811,951 605,328 265,126
Operating expenses 807,871 689,772 707,654
Income before income taxes, minority interest in net earnings
of subsidiary and cumulative effect of accounting change 2,182,969 1,223,399 617,388
Income taxes 779,380 431,403 223,322
Minority interest in net earnings of subsidiary — — 10,070
Income before cumulative effect of accounting change 1,403,589 791,996 383,996
Cumulative effect of accounting change 129,971 — —
NET INCOME 1,533,560 791,996 383,996
Preferred stock dividends 11,501 11,501 11,501
Net income attributable to common stock $1,522,059 $ 780,495 $ 372,495
Basic earnings per common share:
Before cumulative effect of accounting change $ 3.08 $ 1.69 $ .78
Cumulative effect of accounting change .29 — —
BASIC EARNINGS PER COMMON SHARE, AFTER CUMULATIVE EFFECT
OF ACCOUNTING CHANGE $ 3.37 $ 1.69 $ .78
Average common shares outstanding 452,037 462,294 477,233
Diluted earnings per common share:
Before cumulative effect of accounting change $ 3.01 $ 1.64 $ .76
Cumulative effect of accounting change .28 — —
DILUTED EARNINGS PER COMMON SHARE, AFTER CUMULATIVE EFFECT
OF ACCOUNTING CHANGE $ 3.29 $ 1.64 $ .76
Average common and common equivalent shares outstanding 463,335 474,520 490,199
DIVIDENDS PER COMMON SHARE $ .59 $ .28 $ .24
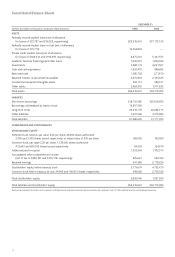
The financial statements should be read in conjunction with the financial statements and notes thereto included in the Company’s Form 10-K filed with the Securities and Exchange Commission.