Rite Aid 2012 Annual Report Download - page 35
Download and view the complete annual report
Please find page 35 of the 2012 Rite Aid annual report below. You can navigate through the pages in the report by either clicking on the pages listed below, or by using the keyword search tool below to find specific information within the annual report.-
 1
1 -
2
-
3
-
4
-
5
-
6
-
7
-
8
-
9
-
10
-
11
-
12
-
13
-
14
-
15
-
16
-
17
-
18
-
19
-
20
-
21
-
22
-
23
-
24
-
 25
25 -
 26
26 -
 27
27 -
 28
28 -
 29
29 -
 30
30 -
 31
31 -
 32
32 -
 33
33 -
 34
34 -
 35
35 -
 36
36 -
 37
37 -
 38
38 -
 39
39 -
 40
40 -
 41
41 -
 42
42 -
 43
43 -
 44
44 -
 45
45 -
46
-
47
-
48
-
49
-
50
-
51
-
52
-
53
-
54
-
55
-
56
-
57
-
58
-
59
-
60
-
61
-
62
-
63
-
64
-
65
-
66
-
67
-
68
-
69
-
70
-
71
-
72
-
73
-
74
-
75
-
76
-
77
-
78
-
79
-
80
-
81
-
82
-
83
-
84
-
85
-
86
-
87
-
88
-
89
-
90
-
91
-
92
-
93
-
94
-
95
-
96
-
97
-
98
-
99
-
100
-
101
-
102
-
103
-
104
-
105
-
106
-
107
-
108
-
109
-
110
-
111
-
112
-
113
-
114
-
115
-
116
-
117
-
118
-
119
-
120
-
121
-
122
-
123
-
124
-
125
-
126
 |
 |
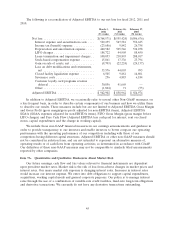
Interest Expense
In fiscal 2012, 2011, and 2010, interest expense was $529.3 million, $547.6 million and $515.8
million, respectively. The reduction in interest expense in fiscal 2012 compared to fiscal 2011 is
primarily due to favorable interest rates resulting from our March 2011 Tranche 3 Term Loan
refinancing and the August 2010 refinancing of our Tranche 4 Term Loan partially offset by the impact
of the fifty-third week. The increase in interest expense in fiscal 2011 compared to fiscal 2010 is
primarily due to the prior year refinancing of our senior secured credit facility and the elimination of
our securitization program which was previously recorded in SG&A, partially offset by savings from our
current year refinancing of our $650.0 million senior secured credit facility term loan.
The annual weighted average interest rates on our indebtedness in fiscal 2012, 2011 and 2010 were
7.4%, 7.5% and 6.8%, respectively.
Income Taxes
Income tax benefit of $23.7 million, income tax expense of $9.8 million and income tax expense of
$26.8 million, has been recorded for fiscal 2012, 2011 and 2010, respectively. Net loss for fiscal 2012
included income tax benefit of $23.7 million and was primarily comprised of adjustments to
unrecognized tax benefits due to the lapse of statute of limitations. We maintain a full valuation
allowance against our net deferred tax assets. ASC 740, ‘‘Income Taxes’’ requires a company to evaluate
its deferred tax assets on a regular basis to determine if a valuation allowance against the net deferred
tax assets is required. In determining whether a valuation allowance is required, we take into account
all available positive and negative evidence with regard to the recognition of a deferred tax asset
including our past earnings history, expected future earnings, the character and jurisdiction of such
earnings, unsettled circumstances that, if unfavorably resolved, would adversely affect recognition of a
deferred tax asset, carryback and carryforward periods, and tax planning strategies that could
potentially enhance the likelihood of realization of a deferred tax asset. A cumulative loss in recent
years is significant negative evidence in considering whether deferred tax assets are realizable. Based on
the negative evidence, ASC 740 precludes relying on projections of future taxable income to support
the recognition of deferred tax assets. The ultimate realization of deferred tax assets is dependent upon
the existence of sufficient taxable income generated in the carryforward periods.
The fiscal 2011 income tax expense of $9.8 million was primarily comprised of an accrual for state
and local taxes, adjustments to unrecognized tax benefits and the need for an accrual of additional
state taxes resulting from the receipt of a final audit determination. The fiscal 2010 income tax expense
of $26.8 million was primarily comprised of an accrual for state and local taxes net of federal tax
recoveries and adjustments to unrecognized tax benefits. We monitor all available evidence related to
our ability to utilize our remaining net deferred tax assets. We maintained a full valuation allowance of
$2,317.4 million and $2,199.3 million against remaining net deferred tax assets at fiscal year end 2012
and 2011, respectively.
Liquidity and Capital Resources
General
We have three primary sources of liquidity: (i) cash and cash equivalents, (ii) cash provided by
operating activities and (iii) borrowings under the revolving credit facility of our senior secured credit
facility. Our principal uses of cash are to provide working capital for operations, to service our
obligations to pay interest and principal on debt and to fund capital expenditures. Total liquidity as of
March 3, 2012 was $913.7 million, which consisted of revolver borrowing capacity of $910.8 million and
invested cash of $2.9 million. We also had cash of $55.7 million at year end that we had set aside to
finalize the call of our remaining 8.625% guaranteed unsecured notes due 2015. These notes were
satisfied and discharged on March 14, 2012.
35