Red Lobster 1999 Annual Report Download - page 22
Download and view the complete annual report
Please find page 22 of the 1999 Red Lobster annual report below. You can navigate through the pages in the report by either clicking on the pages listed below, or by using the keyword search tool below to find specific information within the annual report.-
 1
1 -
2
-
3
-
4
-
5
-
6
-
7
-
8
-
9
-
10
-
11
-
 12
12 -
 13
13 -
 14
14 -
 15
15 -
 16
16 -
 17
17 -
 18
18 -
 19
19 -
 20
20 -
 21
21 -
 22
22 -
 23
23 -
 24
24 -
 25
25 -
 26
26 -
 27
27 -
 28
28
 |
 |

Notes
to Consolidated Financial Statements
43
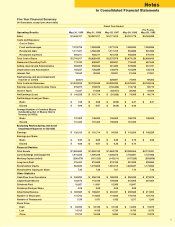
Five Year Financial Summary
(In thousands, except per share data)
Fiscal Year Ended
Pro Forma
Operating Results May 30, 1999 May 31, 1998 May 25, 1997 May 26, 1996 May 28, 1995
Sales $3,458,107)$ 3,287,017)$ 3,171,810)$3,191,779)$ 3,163,289)
Costs and Expenses:
Cost of Sales:
Food and beverages 1,133,705)1,083,629)1,077,316)1,062,624)1,093,896)
Restaurant labor 1,117,401)1,062,490)1,017,315)954,886)931,553)
Restaurant expenses 493,811)482,311)481,348)455,626)470,194)
Total Cost of Sales $2,744,917)$ 2,628,430)$ 2,575,979)$ 2,473,136)$ 2,495,643)
Restaurant Operating Profit 713,190)658,587)595,831)718,643)667,646)
Selling, General and Administrative 360,909)358,542)361,263)373,920)351,197)
Depreciation and Amortization 125,327)126,289)136,876)134,599)135,472)
Interest, Net 19,540)20,084)22,291)21,406)21,901)
Restructuring and asset impairment
expense or (credit) (8,461) 229,887)75,000)99,302)
Total Costs and Expenses $3,242,232)$ 3,133,345)$ 3,326,296)$3,078,061)$ 3,103,515)
Earnings (Loss) before Income Taxes 215,875)153,672)(154,486) 113,718)59,774)
Income Taxes 75,337)51,958)(63,457) 39,363)10,600)
Net Earnings (Loss) $ 140,538)$ 101,714)$ (91,029) $ 74,355)$ 49,174)
Net Earnings (Loss) per Share:
Basic $ 1.02)$ 0.69)$ (0.59) $ 0.47)$ 0.31)
Diluted $ 0.99)$ 0.67)$ (0.59) $ 0.46)
Average Number of Common Shares
Outstanding, Net of Shares Held in
Treasury (in 000’s):
Basic 137,300)148,300)155,600)158,700)158,000)
Diluted 141,400)151,400)155,600)161,300)
Excluding Restructuring and Asset
Impairment Expense or (Credit)
Earnings $ 135,313)$ 101,714)$ 54,330)$ 119,204)$ 108,259)
Earnings per Share:
Basic $ 0.99)$ 0.69)$ 0.35)$ 0.75)$ 0.68)
Diluted $ 0.96)$ 0.67)$ 0.35)$ 0.74)
Financial Position
Total Assets $ 1,905,660)$ 1,984,742)$ 1,963,722)$2,088,504)$ 2,113,381)
Land, Buildings and Equipment 1,473,535)1,490,348)1,533,272)1,702,861)1,737,982)
Working Capital (deficit) (206,478) (161,123) (143,211) (157,326) (209,609)
Long-term Debt 316,451)310,608)313,192)301,205)303,860)
Stockholders’ Equity 964,036)1,019,845)1,081,213)1,222,637)1,173,962)
Stockholders’ Equity per Share 7.30)7.23)7.07)7.70)7.43)
Other Statistics
Cash Flow from Operations $ 348,220)$ 236,125)$ 189,203)$ 294,032)$ 273,978)
Capital Expenditures 123,673)112,168)159,688)213,905)357,904)
Dividends Paid 10,857)11,681)12,385)12,647)
Dividends Paid per Share 0.08)0.08)0.08)0.08)
Advertising Expense $ 180,563)$ 186,261)$ 204,321)$ 239,526)$ 211,904)
Number of Employees 116,700)114,800)114,600)119,100)124,700)
Number of Restaurants 1,139)1,151)1,182)1,217)1,243)
Stock Price:
High $ 23.250)$ 18.125)$ 12.125)$ 14.000)$ 10.875)
Low 14.313)8.125)6.750)9.750)9.375)
Close 21.313)15.438)8.250)11.750)10.875)