Red Lobster 1999 Annual Report Download - page 13
Download and view the complete annual report
Please find page 13 of the 1999 Red Lobster annual report below. You can navigate through the pages in the report by either clicking on the pages listed below, or by using the keyword search tool below to find specific information within the annual report.-
 1
1 -
2
-
 3
3 -
 4
4 -
 5
5 -
 6
6 -
 7
7 -
 8
8 -
 9
9 -
 10
10 -
 11
11 -
 12
12 -
 13
13 -
 14
14 -
 15
15 -
 16
16 -
 17
17 -
 18
18 -
 19
19 -
 20
20 -
 21
21 -
 22
22 -
 23
23 -
24
-
25
-
26
-
27
-
28
 |
 |

Notes
to Consolidated Financial Statements
34
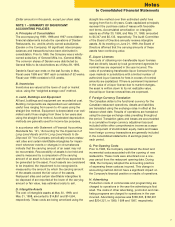
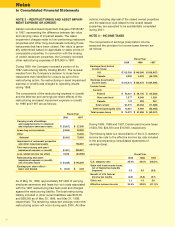
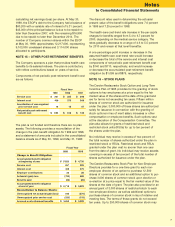
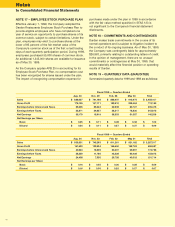
NOTE 3 – RESTRUCTURING AND ASSET IMPAIR-
MENT EXPENSE OR (CREDIT)
Darden recorded asset impairment charges of $158,987
in 1997, representing the difference between fair value
and carrying value of impaired assets. The asset
impairment charges relate to low-performing restaurant
properties and other long-lived assets including those
restaurants that have been closed. Fair value is gener-
ally determined based on appraisals or sales prices of
compara
ble properties. In connection with the closing
of certain restaurant properties, the Company recorded
other restructuring expenses of $70,900 in 1997.
During 1999, the Company reversed a portion of its
1997 restructuring liability totaling $8,461. The reversal
resulted from the Company’s decision to close fewer
restaurants than identified for closure as part of the
restructuring action. No restructuring or asset impairment
expense or (credit) was charged to operating results
during 1998.
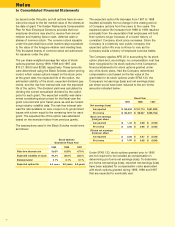
The components of the restructuring expense or (credit)
and the after-tax and earnings per share effects of the
restructuring and asset impairment expense or (credit)
for 1999 and 1997 are as follows:
Fiscal Year
1999 1997
Carrying costs of buildings
and equipment prior to disposal
and employee severance costs $ (3,907) $ 27,500)
Lease buy-out provisions (4,554) 30,000)
Other 13,400)
Subtotal (8,461) 70,900)
Impairment of restaurant properties
and other long-lived assets 158,987)
Total restructuring and asset
impairment expense or (credit) (8,461) 229,887)
Less related income tax effect 3,236)(84,528)
Restructuring and asset
impairment expense or (credit),
net of income taxes $ (5,225) $145,359)
Earnings per share effect –
basic and diluted $ (0.04) $ 0.93)
As of May 30, 1999, approximately $31,800 of carrying,
employee severance and lease buy-out costs associated
with the 1997 restructuring had been paid and charged
against the restructuring liability. The total restructuring
liability included in other current liabilities was $37,139
and $58,265 as of May 30, 1999, and May 31, 1998,
respectively. The remaining restaurant closings under this
restructuring action will occur during early 2000. All other
actions, including disposal of the closed owned properties
and the lease buy-outs related to the closed leased
properties, are expected to be substantially completed
during 2001.
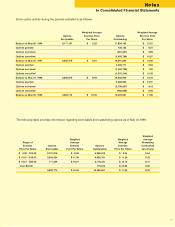
NOTE 4 – INCOME TAXES
The components of earnings (loss) before income
taxes and the provision for income taxes thereon are
as follows:
Fiscal Year
1999 1998 1997
Earnings (loss) before
income taxes:
U.S. $ 212,585 $ 149,096 $(108,687)
Canada 3,290 4,576 (45,799)
Earnings (loss) before
income taxes $ 215,875 $ 153,672 $(154,486)
Income taxes:
Current:
Federal $ 53,621 $ 38,730 $ (13,285)
State and local 7,577 6,349 1,529)
Canada 172 383 367)
Total current 61,370 45,462 (11,389)
Deferred (principally U.S.) 13,967 6,496 (52,068)
Total income taxes $ 75,337 $ 51,958 $ (63,457)
During 1999, 1998 and 1997, Darden paid income taxes
of $34,790, $24,630 and $15,900, respectively.
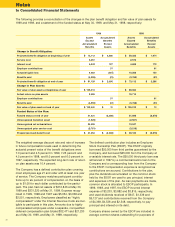
The following table is a reconciliation of the U.S. statutory
income tax rate to the effective income tax rate included
in the accompanying consolidated statements of
earnings (loss):
Fiscal Year
1999 1998 1997
U.S. statutory rate 035.0% 035.0% (35.0)%
State and local income taxes,
net of federal tax benefits
(expense) 003.3 003.3 0(3.3)
Benefit of U.S. federal
income tax credits 0((4.5) 0((5.8) 0(5.7)
Other, net 001.1 001.3 0(2.9
Effective income tax rate 034.9% 033.8% (41.1)%